I’m not a professional investor. I’m an above average-to-good fantasy baseball player. I’m just a fanboy who reads, listens and watches real investors (and pretends to be a real investor). I currently have 40% cash and for the past two weeks I have been wrestling with to do with my cash.
To try to make a better decision I thought it best to write out my best ideas for both the bull and bear case. Charlie Munger said in order to fully understand something you have to know both sides.
I originally wasn’t going to make this public, but when I was scouting the Cal League in 2012 a professional scout, when asked whether to go after a goal, said to me, “sometimes you got to put your dick on the table.” Ever since I heard that I’ve never forgot it.
This is me putting my dick on the table. This is not financial advice. In fact, if you derive any investment ideas from this then you deserve to lose your money because I don’t know anything. Lastly, this is not meant to be a comprehensive list.
Bear Case: Why Not to Buy Stocks
Older People. They make up a big part of the economy. (Source: Numbers from here) People >45 represent 59.7% of consumption. >55 is 41.4%. Will people over the age of 55 really go out and start spending right away?
| < 25 | 9.18% |
| 25-34 | 13.33% |
| 35-44 | 17.77% |
| 45-54 | 18.30% |
| 55-64 | 16.90% |
| 65-74 | 14.13% |
| >75 | 10.39% |
Consumer spending. Heading into 2020 people had a lot of debt. “Consumer debt, not counting mortgages, has climbed to $4 trillion—higher than it has ever been even after adjusting for inflation.” (source: WSJ) Before the crisis hit about 53% of people didn’t have a rainy day fund heading into the crisis. I have to believe the credit cycle has to take shape and since there is so much debt people will not spend as if nothing happened.
Sweden has stayed open and consumption was still down. “All of that is contributing to what Sweden’s government estimates will be a 6% contraction in domestic consumption this year.” (source: WSJ.com)
Jobs/Employment. Blue collar AND white collar jobs have been lost. “An economy cannot consume its way out of a slump–it needs to produce. Capital spending for the sake of spending will not help.” (Source: Bull) If jobs are lost that means we won’t produce as much which will limit growth in GDP.
When the reopening happens businesses can’t be at full capacity. Even if all businesses returned to 90% of their 2019 revenue levels then those companies and governments will be hurt. Restaurants make their profit when they’re about 85% capacity. If they can only be at 60% capacity they’re not going to be profitable.
Price of the Market. Market is pretty expensive right now. The SP 500 is expected to earn $128 per share in 2020, down from $152 at start of the year. The index’s PE ratio is almost 23 times, among the highest ever. The Market is expecting a V-shaped recovery in 2021. The Market is higher now than December 2018. I sincerely doubt the forward looking prospects of the economy is higher now than at the end of 2018.
Macro. There is a high chance the corporate tax rate will increase. Companies were the most profitable as they’ve ever been in 2018 because of the corporate tax cuts. With all this debt we’ll have to start paying it back. Therefore, corporate taxes will have to increase especially if Biden wins.
GDP didn’t drop as much as now compared to previous sessions. In 2009 it dropped 2.5%, 2001 up 1%, 1991 down 0.1%, 1982 down 1.8%. GDP dropped about 4.3% in Q1 2020 and is projected to drop 30% in Q2. Therefore, we have a long way up.
Economy was slowing entering 2020 and revenues/sales were slowing.
The amount of debt is massive. In the last 10-11 years for every $1 of growth we had to finance that with $3.5 of debt. Those numbers exclude the trillions of debt we spent in 2020. It’s difficult to grow economically with a big debt load.
Trade war/rhetoric against China will intensify and could result in tariffs. In 2018-19 the Market would gyrate up and down based on news on tariffs. Even if Biden wins, relations with China will continue to worsen.
Fraud. The fraud cycle follows the economic cycle. Companies are juicing their numbers. For example, a lot of tech companies pays their workers via company stock but they don’t put that expense in the Balance Sheet.
Other countries. Other countries will be affected more harshly than the USA. Emerging markets like Argentina and Brazil could get crushed by the virus because they do not have the economic infrastructure to provide fiscal stimulus.
Bull Case: Why to Buy Stocks
The Fed. The Federal Reserve has unlimited money. “As of Wednesday, the central bank’s balance sheet had increased by more than $2.4 trillion, or 56%, to $6.68 trillion, in eight weeks.” (Source: Barrons) The Market is forward looking so the economic pain the economy is experiencing doesn’t dramatically impact the future cash flows in the next 5-20 years. If the Fed is going to keep the markets going then why fight the Fed?
Value Stocks. According to the latest paper from Cliff Asness value stocks are the cheapest they’ve ever been. So, even if the Market as a whole is expensive it doesn’t mean investors shouldn’t be buying. Should I take my full position on $CSV? $IWN? $IWS?
Also, over a long time horizon it’s better to be in the Market than out of it.
Investor psychology. Howard Marks has said investor psychology is a pendulum that swings from euphoric to pessimistic; it hardly stays in one spot for long; it very rarely stays in the middle. With low interest rates it’s very possible FOMO and/or handcuff volunteers will have to buy equities. “And given Treasury yields under 1% for all but longer bonds, the 2.07% dividend yield on the S&P 500 looks absolutely lush.” (Source: Barrons)
Consumer Psychology. People will be so “crazy” from being self-incarcerated for so long that they will try to return to normal despite the risks of catching the disease. Americans have shown the willingness to exercise their independence and freedoms.
90% of Live Nation customers didn’t take refunds for concerts that were postponed. The company offered a 50% credit (if you have a $100 ticket the company will deposit an additional $50 into the person’s account). If people were really strapped for cash then why not take the refund? Maybe people want the credit? Maybe people are extremely bullish and they’re going to go back to concerts at the end of 2020 and early 2021? Or maybe customers are unaware of the refund? It’s probably a combination of all these but I think the largest percentage of people are expecting to go concerts.
Jobs. Globalization recedes and nationalism gets more entrenched in America and the Western world. More jobs come back to America from China. This won’t happen immediately but in about 3 years more companies will bring jobs back.
Inflation. It’s possible in the next 3, 4, 5-plus years we’ll see high inflation. If we are near the bottom investors are better off having your money in anything besides cash because cash’s value will decrease in a high inflation environment.
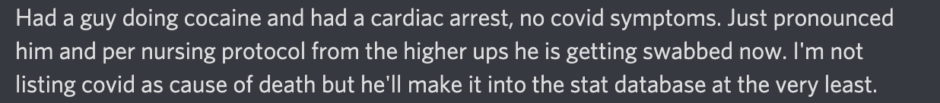
Coronavirus Data is Inaccurate. Maybe the death rate is lower (or higher) than we think?This is anecdotal but a friend of mine is an ER doctor in the Boston area and they’re classifying people who died for non-coronavirus reasons as coronavirus deaths. In his/her words:
Grey Area
Vaccine. The image below are the phases a drug goes through before a drug reaches the public. (Source: The Five Rules for Successful Stock Investing).
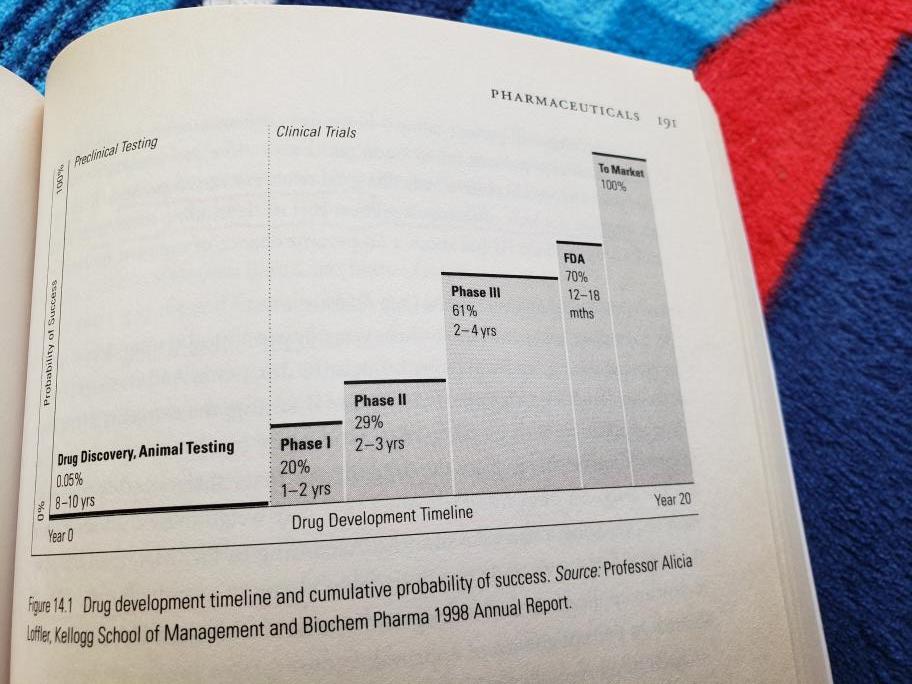
- Phase 1: trial has less than 100 people. Only 20% get past this phase. Phase takes 1-2 years.
- Phase 2: 300-500 people. 50% fail this phase. Takes 2-3 years.
- Phase 3: 5,000-plus people. 60% approval rate. Takes 3-4 years.
A vaccine on average takes 10 years to create. Since the entire world is working on a vaccine there is a high probability we get a vaccine quicker. However, I think it’s extremely bullish to think we get a vaccine in the next 12-18 months. Also, even if we get a vaccine in 12 months that doesn’t necessarily mean consumer behavior will instantly bounce back.
Second Wave. A second wave is going to occur. I don’t know when, but there will be another wave. When the second wave hits, how big will it be? Even if the second wave is larger than the first will the government shut down the economy? Will we as a society not shut down again despite the numbers of deaths? Will the participants in the economy have to (metaphorically) walk past dead bodies?
South Korea tried to open up bars and nightclubs but had to close them for at least 30 days. One man, who showed no symptoms, visited five different spots and gave the virus to 13 people and additional 1,500 people were exposed. (Source: NewsWeek.com) South Korea has extremely good testing and this is the amount of damage one person did. I have a hard time believing America, which doesn’t have enough tests, is going to be able to contain another outbreak.
The fact the Market has ripped despite the unemployment rate increasing to all-time highs may mean Americans A) want companies to pay more in taxes, B) want more anti-Market (anti-capitalistic) legislation and C) will more favorably engage in populism/socialism.