“For years there was no real interest in investing in cement, steel, concrete, fertilizer, chemicals, paper, mining, traditional energy, and housing.
Higher prices aren’t fueling new capacity, instead they’re fueling buybacks, as investors and managements don’t want to underwrite permanently higher prices or margins. Very low P/E multiples in these affected industries don’t inspire long-term capital commitments.
Normally high prices generate a supply reaction. Since this isn’t happening all the work to curtail inflation will have to come from the demand side. As a result prices will have to go much higher to dissuade substantial consumption. As such inflation is likely to be much more persistent.
As a side note and gratuitous reference to our portfolio, this lack of new supply means that companies in these industries are likely to earn excess profits for an extended period of time, making these sectors attractive long investments.”
~David Einhorn (Source: Sohn 2022 via YouTube)
Disclaimer
Nothing discussed/written should be considered as investment advice. Please do your own research or speak to a financial advisor before putting a dime of your money into these crazy markets. In other words, if you buy something I bought, you deserve to lose your money.
The only reason why I am making my portfolio public because it provides accountability to me. Some or all the analysis I provide could be from the top of my head and should not be considered accurate.
My investing goal is simple; to try to manage risk while being fully invested without market timing. Howard Marks said it best, “even though we can’t predict, we can prepare.”
All my references to the Market are only for the US Market.
Performance
For the year thus far my stock portfolio was down 20.02% compared to a negative 20.6% for the S&P 500.
Portfolio Activity
I did a lot of rebalancing.
I sold most of my exposure to Defense companies such as Lockheed Martin, Huntington Ingalls and Northrop Grumman. These were sold in my IRA because I didn’t want to pay taxes on the capital gains. The avoidance of capital gains is why I also sold Newmont and Kinross Gold.
Exxon, Chevron and the other tracking companies such as Conoco Phillips, EOG Resources and Petroleo Brasileiro. I think I understand the bull case for oil; that the world is supply constrained and it doesn’t look like we’re going to have enough supply in the short term. However, the three times America has experienced oil shocks America had a recession and demand for oil decreased. During previous oil shocks companies looked and found new oil sources; I don’t think this is what’s going to happen this time around. There will be some new oil but it won’t be enough to meet demand. I think if demand for oil decreases during a recession that demand will bounce back to where we are today; supply constrained again. I sold the previously mentioned oil companies when crude oil was about $120. I would be lying if not taking some profits on some of my big winners last year didn’t have an effect.
Towards the last few days of the month I sold all of my Prosus at a loss (the losses will be tax loss harvested). During the quarter I read Red Notice and I couldn’t believe all the stupid crap the government continues to do.
For example, this appeared on Doomberg’s Substack.
“A protest planned by hundreds of bank depositors in central China seeking access to their frozen funds has been thwarted because theauthorities have turned their health code apps red, several depositors told Reuters.
The depositors were planning to travel to the central province of Henan this week from across China to protest against an almost two-month block on accessing at least $178 million of deposits, which has left companies unable to pay workers and individuals unable to access savings.
Rights groups have warned China could use its vast COVID surveillance infrastructure to stifle dissent. Without a green code on their smartphone app, citizens lose access to public transport and spaces such as restaurants and malls, as well as the right to travel across the country.
“They are putting digital handcuffs on us,” said a depositor from Sichuan province surnamed Chen, who declined to use his full name for fear of government retribution.”
Another example is China may have its Zero Covid Policy until 2027. I understand the pessimism with China was/is extremely high but I didn’t my capital exposed to China’s regulatory nature anymore. I blame myself for this investment. I should have been slower with building of the position.
Company Commentary
I re-launched my position in Carriage Services. I originally bought the business in March 2020. I got a double and moved on. After I sold my shares I stopped following the business and I deeply regret it. Since I exited my position the company has bought back 20% of its shares and restructured their debt. Specifically, the original debt was refinanced at a lower rate and the debt isn’t due until 2029.
A quick recap of the company is Carriage Services is a funeral home business. The company was founded in 1991 by Melvin Payne and he’s still involved in the company. Over the last couple of years he’s brought in three people who are responsible for the company’s future. They operate 170 funeral homes in 26 states and 31 cemeteries in 11 states.
There are four publicly traded companies in this business segment and they control approximately 25% of the funeral services market. In other words, the market is very fragmented and dominated by local businesses. This fragmentation gives Carriage a tremendous moat. Because most people don’t want to enter the field there are hardly ever new competitors entering local markets.
It’s very possible the American economy is entering a recession and the businesses I want to own are the ones who are isolated from economic slowdowns, are cash flow generating, inflation resistant and have great management teams that will buy back the stock if its cheap. In regards to Carriage being inflation resistant, I highly doubt people will haggle with funeral home providers over the price of a coffin. They may go with the cheaper coffin but Carriage should still make a profit even with cheaper items. Additionally, with inflation people may be more inclined to signup for preneed services. Preneed services is a prepay for funeral services. For example, buying a plot or reserving space for their ashes. Lastly, this is a business segment that truly isn’t effected by the broader economy. An X% of people are going to die every year regardless of the state of the economy.
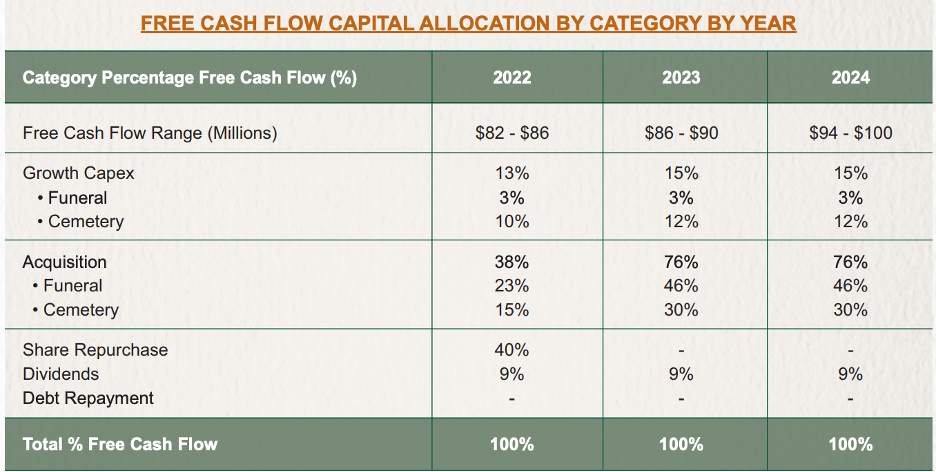
As of July 1 the company has a Market cap of $599 million. Management is forecasting about $85-90 million in free cash flow per year for the next three years, which means they’ll be able to buy all their shares in seven years. Management has hinted in their latest investor call that they may be making an acquisition. Suppose the business makes an acquisition(s) and earns $90 million in free cash per year for the next 5-10 years. Management is using a Free Cash Flow Yield of 6.4-7.4% which is far. Using those two numbers the market capitalization range is $1,216 – $1,406 million. Divide those numbers by 16.5 million fully diluted shares and you get a share price value of $73.70 to $85.21.
Source: https://investors.carriageservices.com/static-files/eb24e401-c458-4098-bc1b-34ac534c6d2e
Market Commentary
Maybe it’s me but there’s a lot of bearishness in the media and on FinTwit. The question is the bearishness about the economy warranted? Another question is why is there so much bearishness in the media? The answer is the media makes more by promoting fear more than any other emotion.
Let’s take a look at both positive and negative views/information about the economy.
Bearish
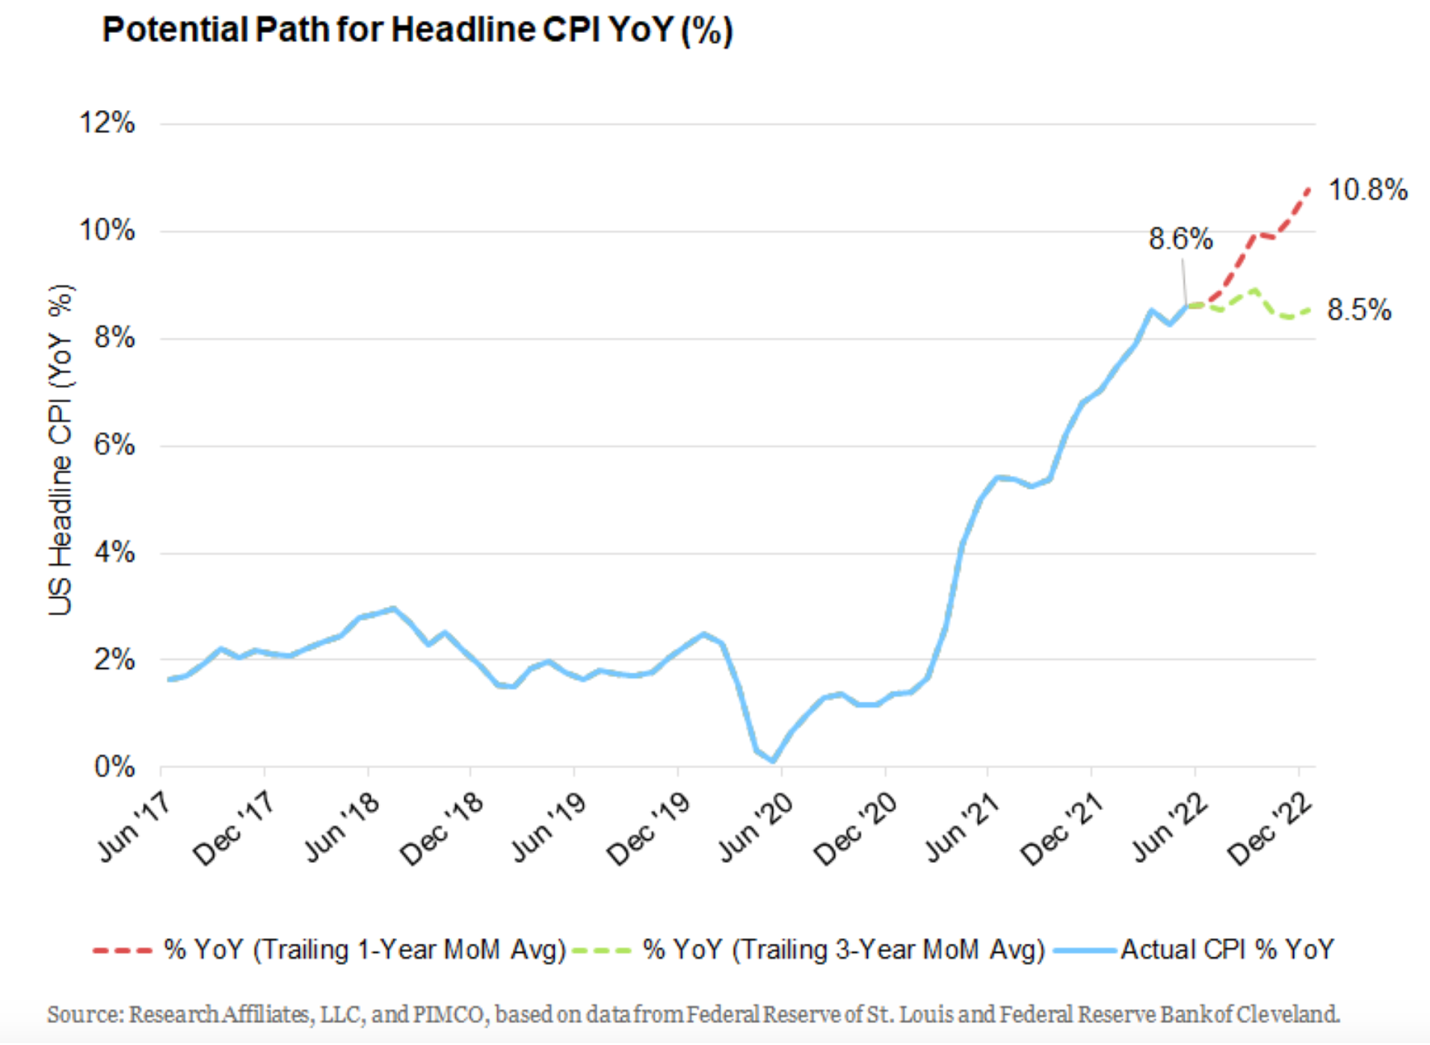
Rob Arnott thinks inflation will at the very least remain at current levels for the next four months.
“The near-term prognosis for inflation is not good. Each month’s 12-month inflation rate matches the previous month’s inflation rate, plus a new month, minus the corresponding month dropped from the previous year. We can’t know with any confidence what the new month’s rate will be, but we know with precision the rate of the month being dropped. The next four months to be dropped from 2021 will be 0.9%, 0.5%, 0.2%, and 0.3%, respectively. The Cleveland Fed produces an “inflation nowcast” which estimates what the monthly inflation would be if the month ended today. If their nowcast is correct, the 0.9% from June 2021 will be replaced with 1.0% for June 2022. If inflation in each subsequent month through year-end 2022 matches the average inflation rate over the prior 12 months, we should finish the summer at 9.9% and finish the year at 10.8%. If, alternatively, monthly inflation recedes to match the trailing 36-month average, then the current 8.6% inflation rate would remain steady through year-end. This simple analysis leads us to believe that inflation will likely get worse before it gets better. (source: https://www.researchaffiliates.com/publications/articles/933-no-excuses-plan-now-for-recession”
Ray Dalio is predicting we’re going to have stagflation.
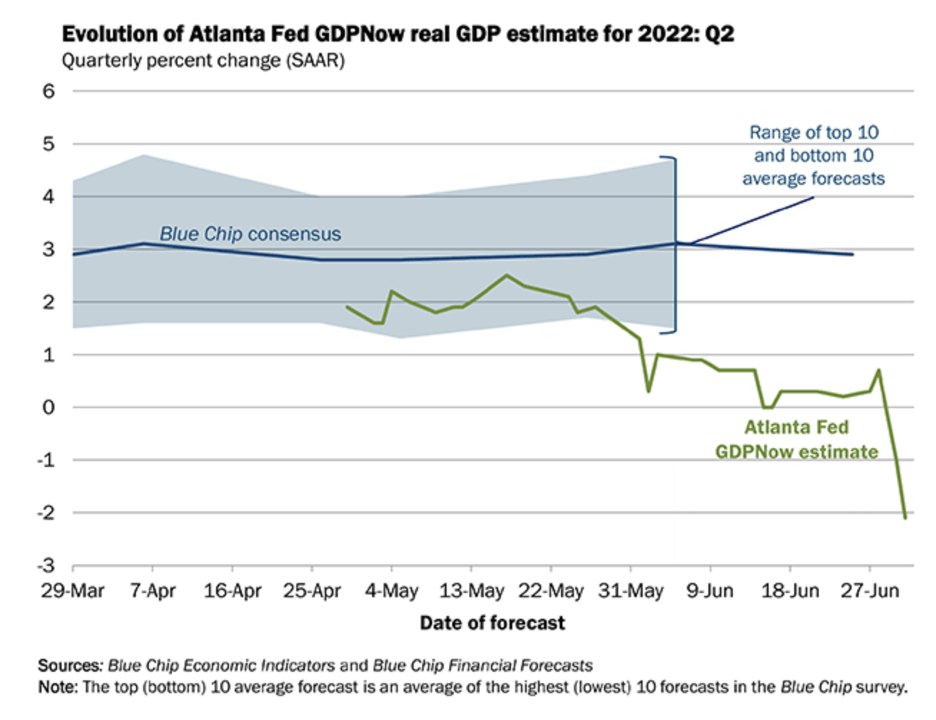
Per the Bureau of Economic Analysis, real GDP contracted by 1.5% during this year’s first quarter. If that trend were to continue, then this bear market would fit the usual pattern, by materializing several months after a recession began. As of July 1, the Atlanta Fed says GDP contracted by 2.1%…so if you use the definition of two consecutive quarters of negative GDP we’re already in a recession.
The High Yield Index, which Verdad uses as a prime measure of economic distress, has been increasing.
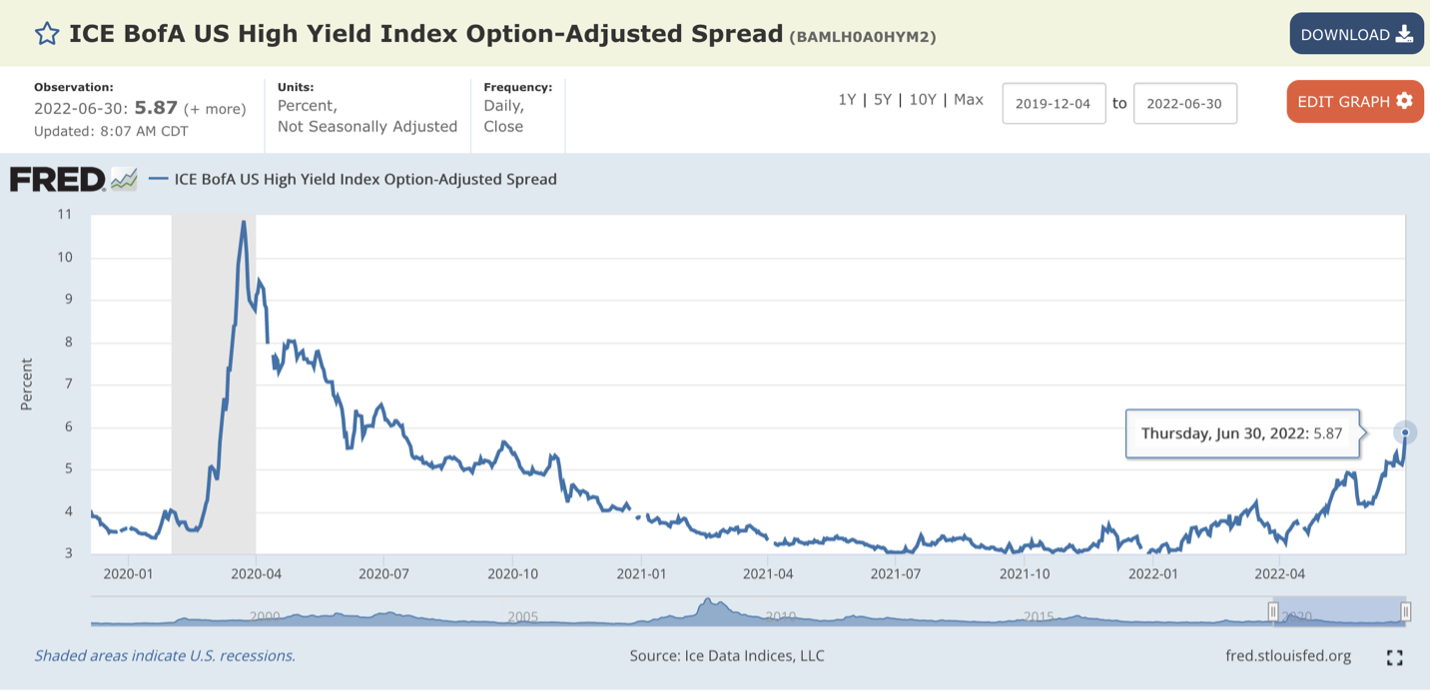
Image Source: https://fred.stlouisfed.org/series/BAMLH0A0HYM2
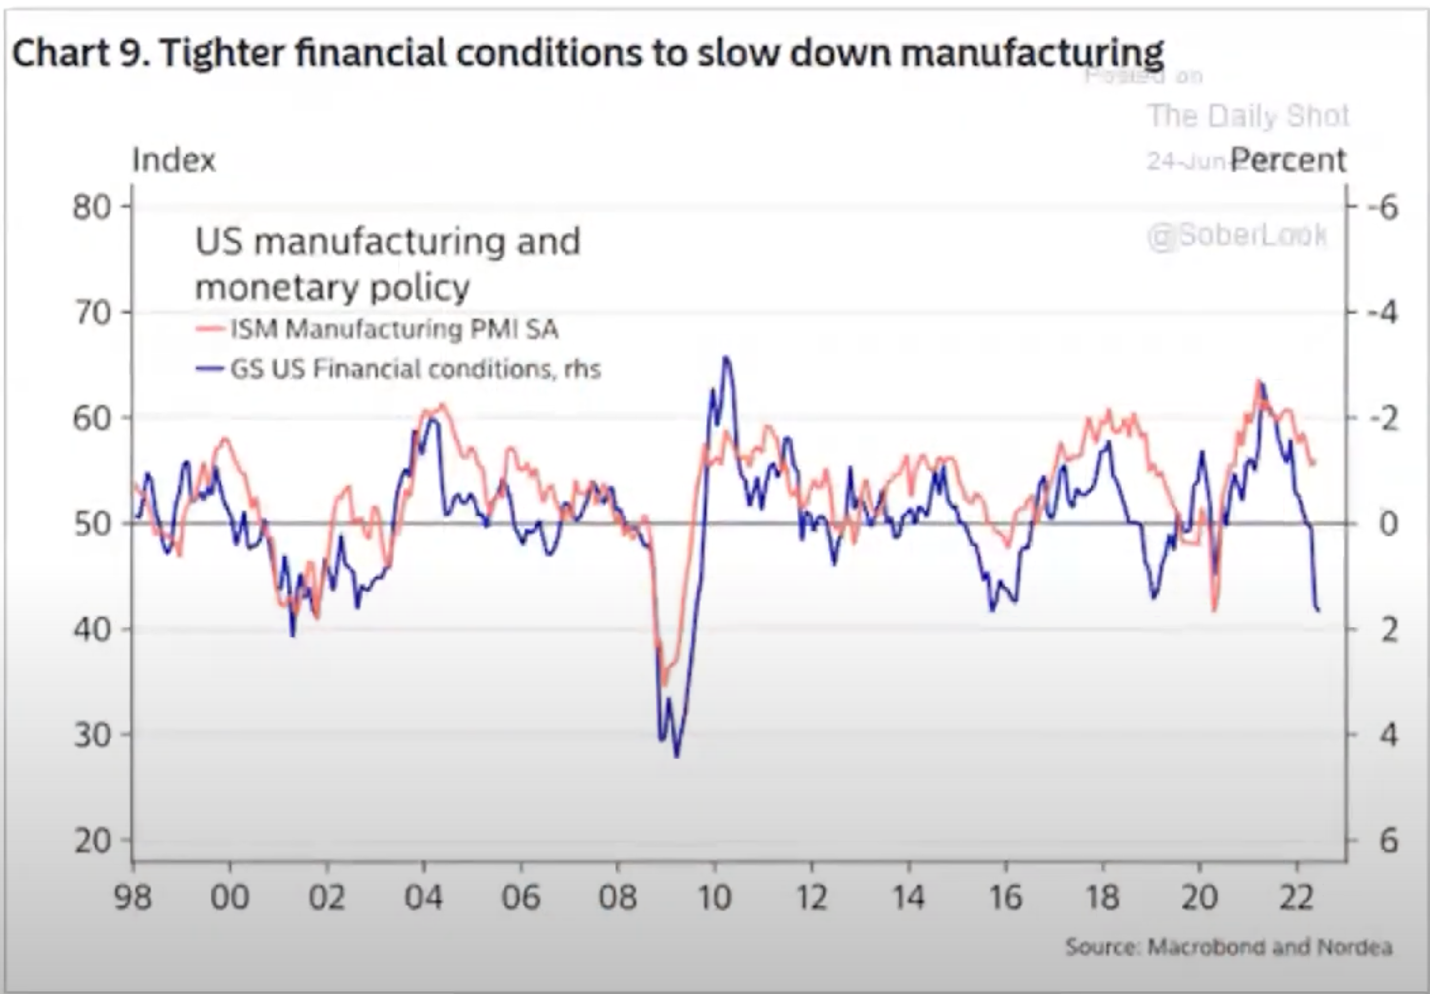
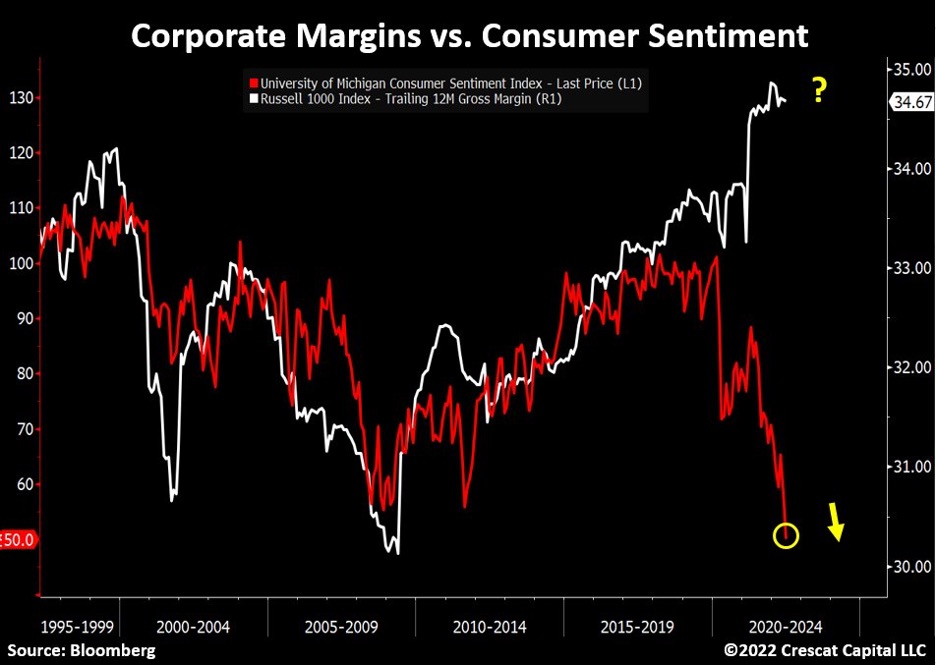
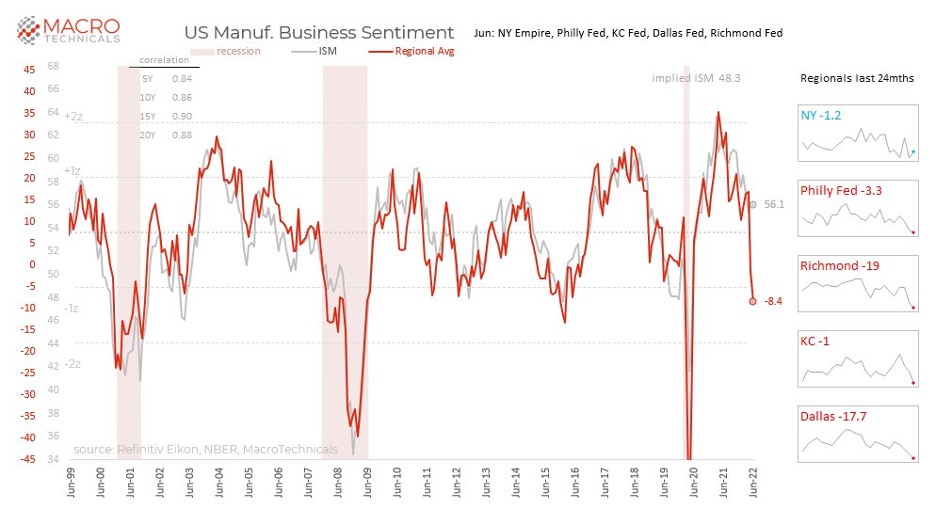
Below are three additional charts.
Bullish
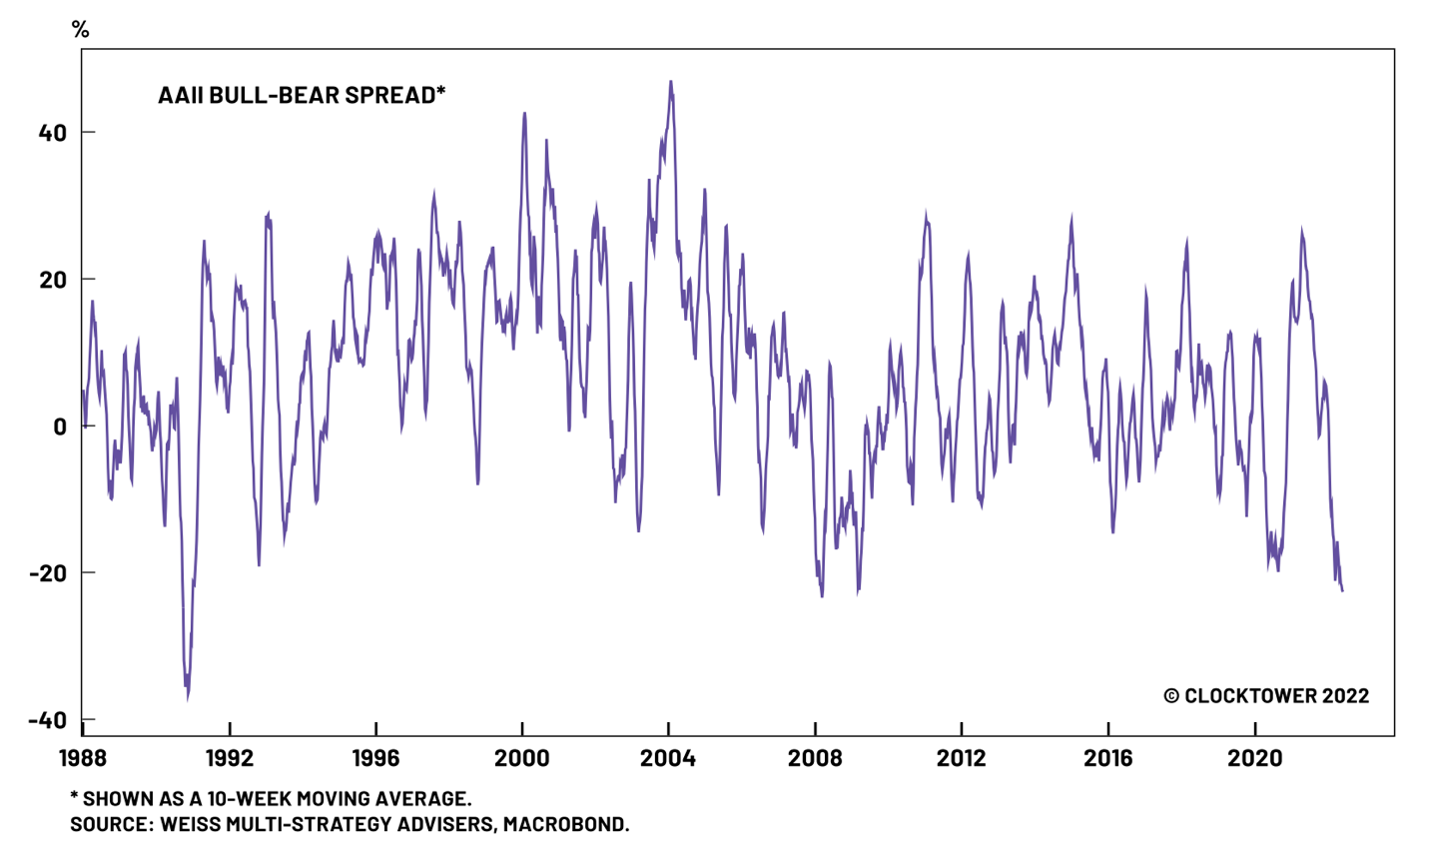
It’s possible we’ve recently reached max bearishness (image below).
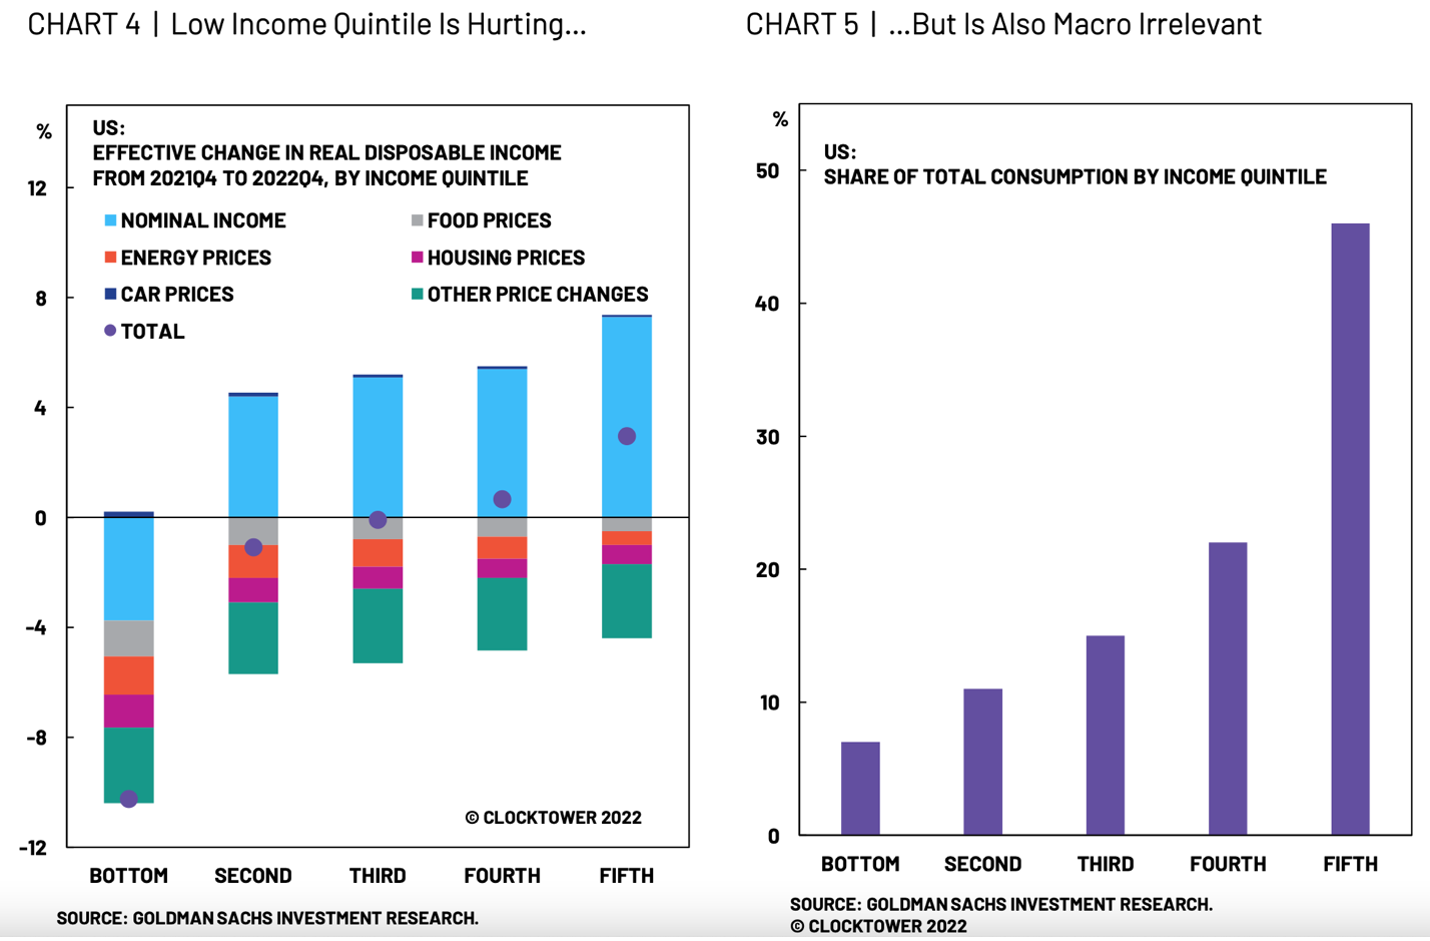
In terms of the economy, most Americans are set up to deal with inflation pretty well (image below).
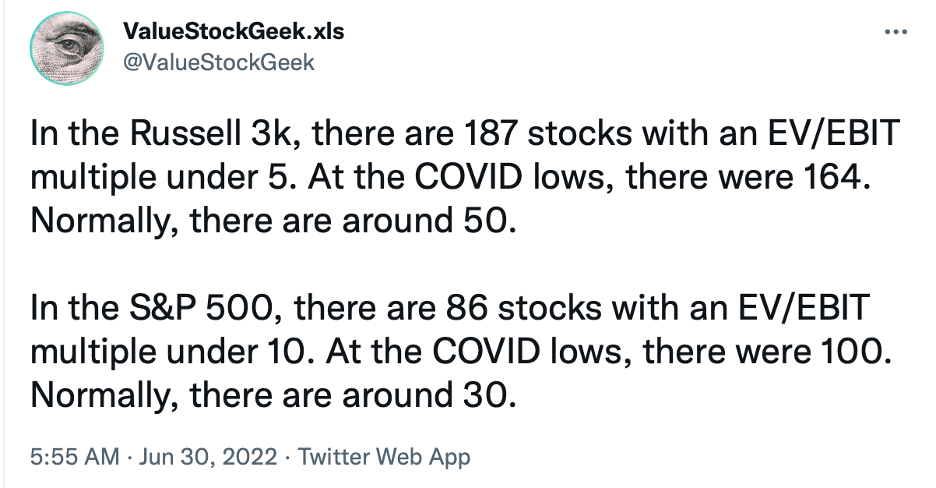
There a lot of companies that are statistically really cheap; if someone has a long term view there’s a lot businesses on sale.
My Status
A year ago my plan was to put money in I Bonds every year and at the end of the fifth year take the money out tax free (I still have to pay Federal taxes but not state taxes) to make payments on my house. However, with the Market selling off deploying my cash will (hopefully) be more profitable. I’m currently treating the I Bonds I own as my rainy day fund and will only be cashed out in an emergency or if the Market gets incredibly cheap like in 2009.
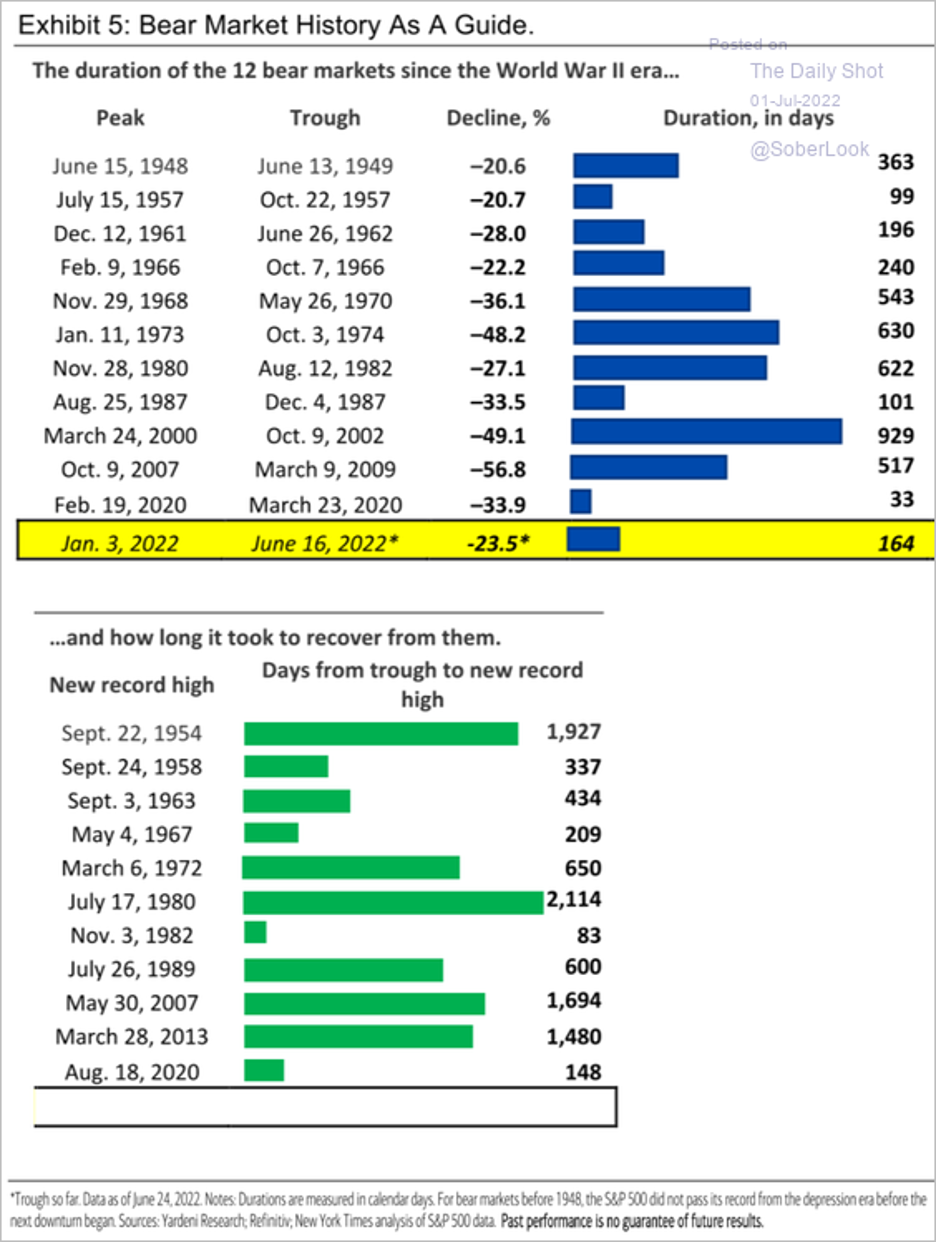
I currently have about 14% in cash. Is that too much? Too little? I don’t know. Below shows the drawdowns of every bear market since 1948. On average the Market drops by 34.2%. We’re currently down 20% so it’s possible we stay at this level and experience a sideways market for a few years while growth catches up.
The questions I keep coming back to are how will I feel if I hold cash and the businesses I like rocket up towards their intrinsic value? Or how will I feel if I deploy all my cash and the businesses I like go down another 10-30%?
Warren Buffett said he doesn’t look at macro factors but its important to qualify his opinion. If Berkshire has $50 million in cash and deploys it, his business will generate that much cash in near future. As for me it would probably take 7-9 years to get that cash back by working. A retort to my reservation is no one can time the bottom and if the business continues to improve who cares if the price drops in the near term.
In 2011 the High Yield Index got as high as 8.98 before coming back down. In 2016 it got as high as 8.6 before decreasing. I read stories about people who got out of the Market in 2011 and never got back in because they were waiting for a pullback. Is that an outcome I’d be okay with? No. However, on the other hand, the Federal Reserve is tightening and that’s not bullish for the economy.
I will admit holding cash these past 1-2 weeks has been extremely difficult because I’ve been agonizing about if this is the low point for the foreseeable future. Holding cash during bear markets requires you have to endure bear market rallies. Two examples below:
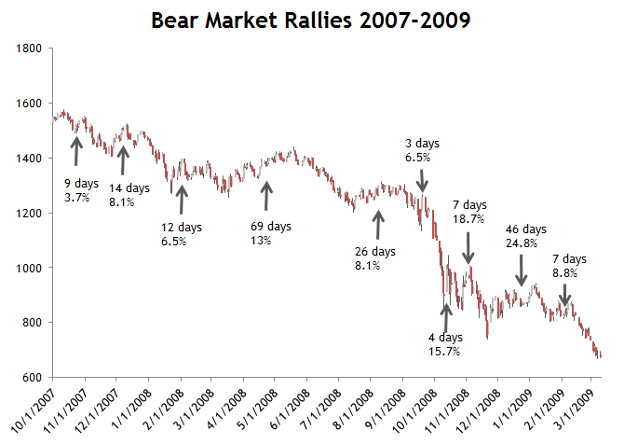
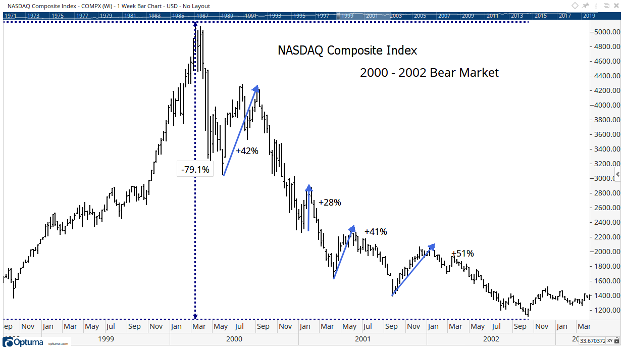
The most important question is if I decide to hold cash am I capable to hold onto that money?
“The big question that we all face, as we look towards the second half of the year, is whether the pullback in risk capital is temporary, as it was in 2020, or whether it is more long term, as it was after the dot-com bust in 2000 and the market crisis in 2008. If it is the former, there is hope of not just a recovery, but a strong rebound in risky asset prices, and if it is the latter, stocks may stabilize, but the riskiest assets will see depressed prices for much longer. I don’t have a crystal ball or any special macro forecasting abilities, but if I had to guess, it would be that it is the latter. Unlike a virus, where a vaccine may provide at least the semblance of a quick cure (real or imagined), inflation, once unleashed, has no quick fix. Moreover, now that inflation has reared its head, neither central banks nor governments can provide the boosts that they were able to in 2020 and may even have to take actions that make things worse, rather than better, for risk capital.” Source: Aswath Damodaran
Peter Lynch said, “Far more money has been lost by investors preparing for corrections or trying to anticipate corrections than has been lost in corrections themselves.”
“As with many things in investing, there isn’t a one-size-fits-all answer to these questions. I think the most important thing that an investor can do is to ensure they’ve implemented an approach that will allow them to remain committed to a thoughtful, long-term investment strategy regardless of what the economy and / or Mr. Market throws at you over next three months (or three years).” Source: The Science of Hitting
“Being defensive can be costly in the short term. Indeed, spreads could reverse course and risk assets could see a recovery. And buying at this point has been the correct decision about 45% of the time. If wrong, however, downside losses could be significant, as every major market drawdown event has occurred following a move in spreads to this level.” Source: Verdad Research
The last quote from Verdad is the opinion I currently have. If the odds are 50/50 that the economy experiences a recession then 14% cash is reasonable because I’m allocating 86% of my capital to an outcome that has a 50% chance of paying off. If the Market doesn’t get any lower then 86% of my capital will benefit, which is fine with me.
The table below is a breakdown of my portfolio at the end of Q2. What you see below where my entire net worth, excluding my home, is allocated. Lastly, my 401k is 100% invested in a Small Cap Value Fund.
| Company | % |
| BRK.B | 11.3% |
| MU | 7.7% |
| CSV | 7.3% |
| AIMFF | 5.0% |
| MKL | 4.7% |
| MMP | 3.6% |
| BAC | 3.5% |
| SCHW | 3.2% |
| MO | 3.2% |
| EPD | 2.7% |
| PLXP | 2.6% |
| EQC | 2.0% |
| GVAL | 1.5% |
| GD | 1.1% |
| C | 1.0% |
| INTC | 0.9% |
| PREKF | 0.7% |
| DFIC | 0.6% |
| DISV | 0.6% |
| BHF | 0.5% |
| DFIV | 0.5% |
| AVIV | 0.5% |
| FPI | 0.0% |
| LAND | 0.0% |
| AVDV | 0.0% |
| AVDE | 0.0% |
| AVES | 0.0% |
| AVSC | 0.0% |
| DFSV | 0.0% |
| Gold | 3.1% |
| Platinum | 0.7% |
| Farmland | 4.2% |
| I Bonds | 7.7% |
| Cash | 13.7% |
| 401k | 6.1% |
Below is a breakdown by category:
| Category | % |
| Bonds | 7.7% |
| Cash | 13.7% |
| Conglomerate | 11.3% |
| Defense | 1.1% |
| Financials | 8.2% |
| Funeral | 7.3% |
| Insurance | 4.7% |
| International | 3.7% |
| Manager | 5.0% |
| Oil/Gas | 6.9% |
| Other | 3.2% |
| Pharma | 2.6% |
| Precious Metals | 3.8% |
| Real Estate | 6.2% |
| Semiconductor | 8.6% |
| Small Value | 6.1% |


