Disclaimer
Nothing discussed/written should be considered as investment advice. Please do your own research or speak to a financial advisor before putting a dime of your money into these crazy markets. In other words, if you buy something I bought, you deserve to lose your money.
The only reason why I am making my portfolio public because it provides accountability to me. Some or all the analysis I provide could be from the top of my head and should not be considered accurate.
My investing goal is simple; to try to manage risk while being fully invested without market timing. Howard Marks said it best, “even though we can’t predict, we can prepare.”
All my references to the Market are only for the US Market.
Performance
For the year I returned 30.01% compared to 21.39% for the S&P 500 (with dividends reinvested). Most of the return was due to Berkshire Hathaway, British American Tobacco, Carriage Services and making some timely trades in early August.
The table below is a breakdown of my portfolio at the end of Q3. What you see below where my entire net worth, excluding my home, is allocated.


Portfolio Activity
I started positions with Disney, Marcus Corp, MGM and Etsy. I also made a 4.5% collective bet on Cannabis ETFs and three cannabis companies Cronos Group, Grown Rogue International and Glass House Brands.
Cronos Group currently has about $1.15 billion in cash (Canadian) and it has a market cap of $1.13. The price per gram has bottomed tremendously, which is depressing the stock price. For example, in March of 2019 the price was $7 per gram. In September it was $4.31. Canadian law says if you make $10 or less per gram, $1 has to be paid in taxes. Altria owns 45% of the company and they have seats on the board. The low cost per gram is a double edged sword. If prices stay low then the smaller companies will go out of business and Cronos with its large cash pile and access to capital will survive. If there is a government change and the $1 tax gets reduced or goes away the company will become more profitable.
Grown Rogue is a craft cannabis company operating in Oregon, Michigan, Minnesota, Maryland, and now New Jersey. Think of it terms of brewery terms;
Grown Rogue is the equivalent of Russian River Brewing or Great Notion Brewing. Most of their revenue comes from Oregon and Michigan. The price of cannabis varies wildly by state (image below).
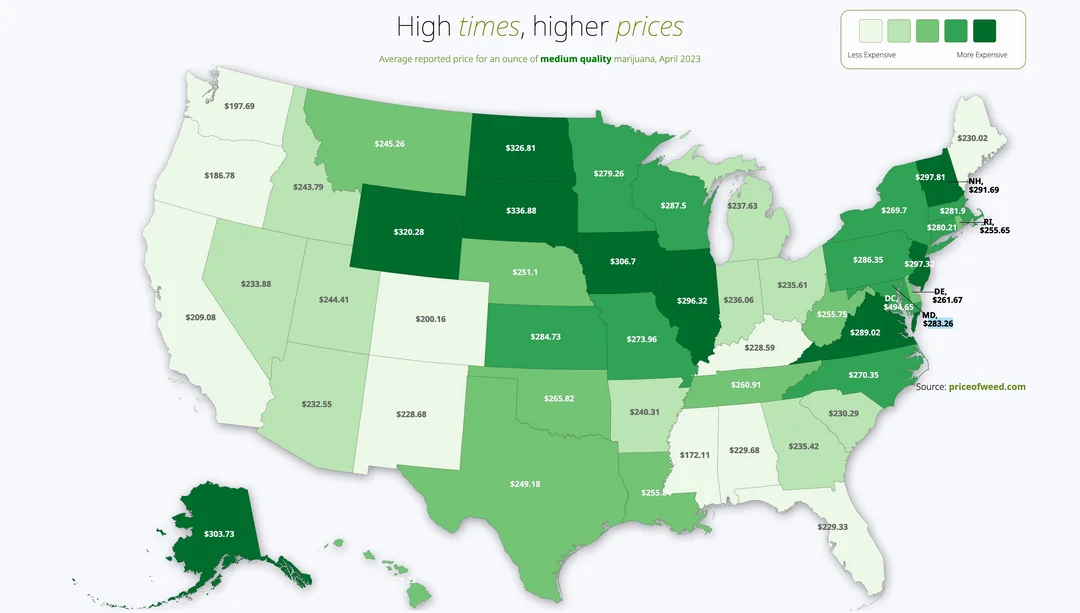
In late August the company announced operations in New Jersey just launched, “The first harvest is planned for November with sales following shortly thereafter.” You will notice that prices in New Jersey are much higher than Oregon and Michigan. In fact Oregon has the lowest cannabis prices and they were able to make a profit; $4.6 million in 2023. When they went into Michigan prices dropped 60% percent and they were still able to make a profit; $6.6 million in 2023.
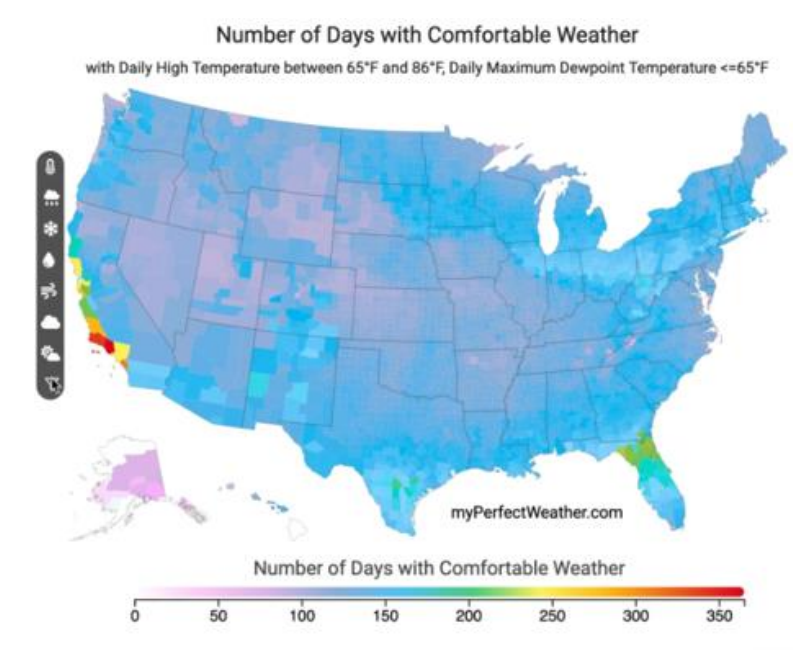
Picking back on the beer analogy. If Grown Rogue is Russian River Brewing then Glasshouse is Coors with the only exception being Glasshouse makes high quality cannabis at much lower price than their competitors. Their manufacturing facility is in Ventura County which has the most days of comfortable weather in America.
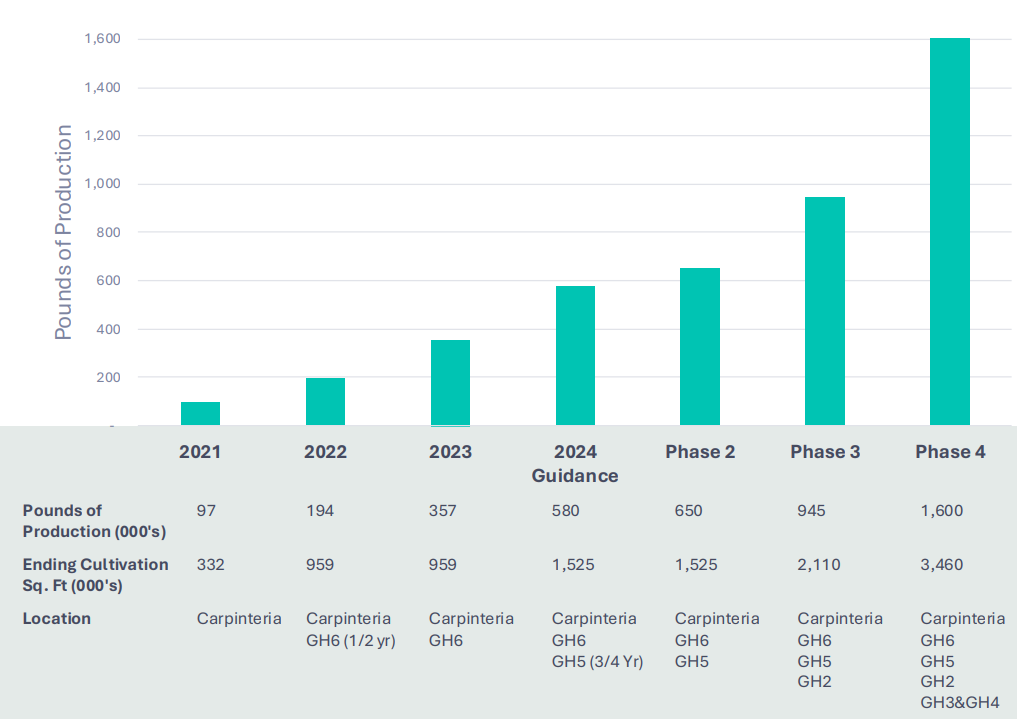
Grown Rogue makes about 30,000-35,000 pounds of cannabis annually while Glasshouse will make about 580,000 pounds this year and is projecting to more than double that (image source) when all six greenhouses are operational.
Etsy
Etsy is a cash generating machine. Their trailing 12-month free cash flow is currently roughly $690 million and in the last four calendar years they’ve averaged free cash flow of $653 million. I bought shares when their market cap was $6.14 billion. Also, Elliot Management owns about 13% of the stock.
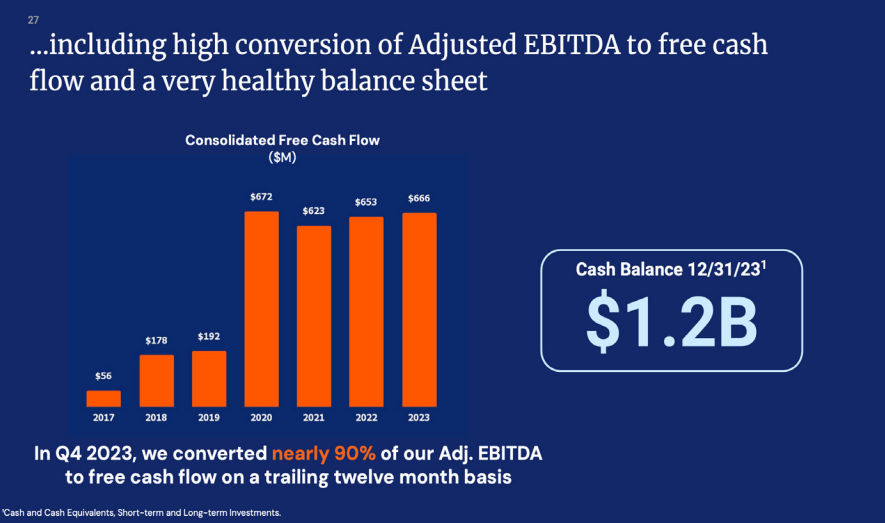
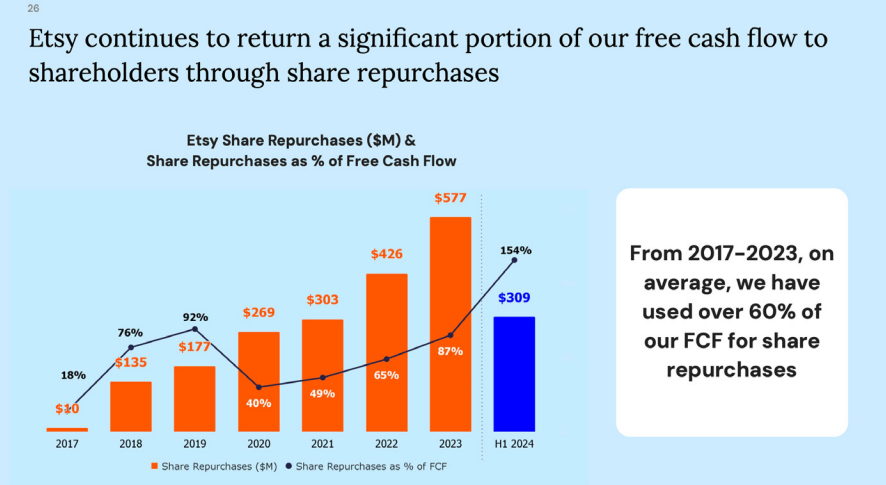
Another catalyst is from 2017-2023, they have used 60% of its free cash flow for buy-backs. During its most recent quarter, given the depressed share price, it bought back shares with 154% of its free cash flow.
There are headwinds with competitors like Temu as well as recession. Also, since Etsy doesn’t produce anything they have to maintain a great network of artists/creators while having customers believe they are receiving unique and/or vintage products.
MGM
What intrigued me initially was that they have reduced their share count by 40% in the past three years (from 500 million to 300 million shares). I bought the stock at about $37, which was a little less than a $12 billion market cap.
MGM also owns 56% of MGM China and that stake alone is probably worth $8-12 a share. The company generated $8 in free cash flow last year. In the latest earnings call management said, “The increase in free cash flow and reduction in share count would result in a mid-teens free cash flow per share compound annual growth rate by 2028.”
The market cap seems pretty cheap to me. The stock price seems depressed due to recession risk but I think that is somewhat baked into the stock price. In the last two years the EPS was on average $3.35. If you give them a high-teens P/E, then shares should be in the low to mid $50s.
Marcus
In regards to Marcus, my position is half the size of Etsy because I’m still getting a better understanding of the business. What I like about Marcus is the diversity of the revenue stream between movie theaters and hotels and resorts. More of their money comes from theaters but hotel revenues are pretty consistent which smoothes out the volatility in movie theater revenues.

Delek
As of July 8, 2024 Delek is trading less than it did a year ago. Delek is a very interesting business and looks really cheap. Delek’s core business is oil refining; a minor part of their business is retail (gas stations).
Delek also owns roughly 73% of Delek Logistics Partners, a MLP that owns and operates pipelines, trucks, and ancillary assets that provide crude oil gathering, refined products, transportation and storage services.
DKL has a market cap of $1.9 billion and if Delek owns 73% that means Delek owns about $1.39 billion. However, Delek’s market cap is $1.46 billion. If you bought Delek stock that means you’re getting the refining business for free. In 2023 the refining business made $529.4 million in EBITDA.
According to the 10-k Delek has $2,496.9 million in long-term debt. However, that is a little misleading because $1,601.2 of that debt belongs to DKL. That debt is non-recourse to Delek. Delek itself has $895.7 million long-term debt compared to $743.7 million in cash.
In the past two years Delek repurchased about 6% of its stock. However, there wasn’t any stock repurchases in Q1 or Q2 of 2024. On July 31, their Board approved another 0.5% per share increase to regular dividend which means the quarterly dividend is $0.255 per share. There is still $180 million available for repurchases. I have no idea why they chose to increase the dividend when they could buy back their shares.
Thrift Bank Update
Two years ago I initiated small positions in a handful of thrift banks. My expectation was to buy a small amount of them and see how the business would do during the thrift conversion process. The thesis was to set it and check-in on all of them in two years,
The first thrift I’ll discuss is First Seacoast Bank (FSEA). FSEA was originally in the first step of the thrift process but in January 2023 they completed the second step. This is exciting news because it typically takes three years before the bank is acquired. Tangible book value is roughly $66.6 million but the market cap is $44.56 million.
As of June 30, 2024 the company has repurchased almost 6% of its stock with board approval to buy 4% more. The average ROE is about 2-3% which is below average but the Equity to Asset ratio is about 12% which is good. Also, non-performing assets as a percent of total assets is 0.02%. I increased my position size by 1.5x.
The biggest winner of the group has been NorthEast Community Bancorp, Inc. (NECB). The stock is up 84% from my purchase price and I can see why. Since 2016 they have an average ROE of 9.11% which is fantastic and for the first half of the year they generated an EPS of $1.84. They’re currently trading at 1.02x book value.
In the last 18 months the company has bought back approximately 20% of its shares. It’s been three years since they completed the second step so they’re at the time when they should be purchased. I didn’t see any commentary from management about being acquired. From what I can tell this is a well run bank. Even though its trading at book value the average multiple of thrifts being acquired is 130-140% times book.
Three weeks ago Cullman Savings Bank (CULL) announced its voluntary delisting from the NASDAQ Capital Market and deregistration with the SEC. The decision, driven by cost-saving measures, is feasible as the company has fewer than 1,200 shareholders. They will continue to have their financial statements audited and report quarterly results to federal regulators, which will remain publicly accessible.
The business is trading at 65% of book value with an average ROE of roughly 4%, which is average. The equity to assets ratio the past three years is about 23% which is good. The percentage of non-performing assets against all assets is 0.10% on average the past three years. The deposits look good; only 34% are CDs. About half of their loans are to residential housing with 33% loans allocated to commercial real estate.
The bank also began the second step process three years ago so it’s possible they get acquired within the next 12 months. Since 2022 they’ve bought back roughly 3-4% of their shares. Even though the shares are no longer on the Nasdaq the bank seems to be well run and the valuation is so cheap I’m adding to my position.
TC Bancshares Inc (TCBC) also decided to voluntarily delist from the Nasdaq. The company is trading at 86% of book value with ROEs about 4%. In the last three years they have repurchased about 15% of their stock. The company also reached three years since its standard conversion was announced so its possible they will get acquired in the next 12 months.
The equity to risk-weighted assets last year was 20.96% and in 2022 it was 22.57%. Total non-performing assets was 0.29% and 0.28% in 2023 and 2022 respectively. In regards to loans, 39% are to residential and 32.7% to commercial real estate. Commercial real estate loans consist of loans to finance real estate purchases, refinancings, expansions and improvements to commercial properties. These loans may be secured by first liens on office buildings, farms, retail and mixed-use properties, churches, warehouses and restaurants primarily located within the Company’s market areas. I will not be adding to my position.
PB Bankshares Inc (PBBK) trades at 85% of book value. Like other thrifts mentioned previously their average ROEs are about 4%. The company also reached three years since its Standard conversion was announced so its possible they will get acquired in the next 12 months.
The equity to risk-weighted assets last year was 12.95%. Total non-performing assets was 0.30% the past two years. Only 40% of the deposits are CDs which is good.
At the end of 2023 57% of their loans are for commercial real estate with roughly 75% of those loans due in the next 5-15 years. Their commercial real estate loans are typically secured by medical, industrial, warehouse, retail or other commercial properties. Their commercial real estate loans generally have fixed rates with terms of three, five, seven or ten years and amortization terms of 20 to 30 years, with a balloon payment due at the end of the term. In the last two years they have repurchased about 5% of its shares. I’m adding to my position.
Texas Community Bancshares Inc (TCBS) has only averaged 1.3% ROE the past four years and is trading at 85% book value. Of the banks I’ve discussed this far it appears to be the lowest quality.
The average equity to average assets was 9.77 and 11.61 in 2023 and 2022 respectively. The total nonperforming assets to total assets was 0.30 and 0.28 in 2023 and 2022 respectively. About 65% of their loans are 1-4 Residential and multi-family with 15% of loans to commercial real estate.
In 2023 they bought back 5% of shares with the board approving another 5% buyback for 2024. That said, for the first half of the year they had a net loss. The valuation is unappealing to me.
Bogota Savings Bank (BSBK) has an average ROE of 3.65% the past six years and its trading at 70% of book value. The bank went public, as a first step conversion, in January 2020. It typically takes five years to go from the first step to a second step conversion. On April 24, 2024, the company announced it had received regulatory approval to repurchase 5% of its then outstanding common stock, which they completed in March 2024 (for an average price of $8.15). In April they received approval to buy another 5% of their stock back.
Their equity to assets ratio in 2022 was 16.22% and in 2023 14.89% which is fantastic. There was a slight uptrend in non-performing assets, going from 0.09% in 2022 to 1.36% in 2023. In regards to non-time deposits, like CDs, 72.8% of their deposits are CDs which is very high. I will be adding to my position.
Columbia Financial, Inc. (CLBK) initiated its first step conversion in April 2018. As I write this the company has not gone forward with the second step conversion which makes it difficult to value the company. There are 104,727,144 shares outstanding, but the float is only 28,710,620 shares. In the last six years they’ve bought back 7.2 million shares at an average price of $16.52 per share. I only own one share and I am going to keep it that way.
CFSB Bancorp, Inc. (CFSB) had their first step conversion in January of 2022. It sold 2,804,306 shares while 3,828,336 shares belong to the mutual holding company (MCH). Its currently trading at 58% of book value.
They didn’t have any non-performing assets in 2022 or 2023. Their reserves look good as the Tier 1 capital to adjusted total assets is 18%. Also 63% of their deposits are non-time deposits. About 79% of their loans are to 1-4 family residential, which explains the low 1.9% ROE in 2023. In April 2024 the company announced a 5% share repurchase. I bought more shares.
Federal Bank of Wisconsin (FFBW) is another second step thrift that IPOed in January 2020 which means they could be acquired in the next 12 months. They are trading at 86% of book value. The ROE the last five years is about 2.5%. The credit quality and reserves all look good. They started repurchasing shares in 2023 buying back roughly 8%.
William Penn Bancorp (WMPN) is second step thrift that IPOed in March 2021. Its currently trading at 89% of book value. The last five years they’ve had an average ROE of 1.5%. As of June 30, 2024, they have repurchased a total of 6,298,086 shares, or approximately 49% of shares sold in their second-step conversion, at a total cost
of $73.7 million, an average of $11.70 per share. The reserves look good; the non-performing assets was only 0.49%. The loan book looks good.
New Thrift Holdings
Ponce Financial Group (PDLB) had their first step in October 2017 and had their second step in January 2022. The company is trading at 53% book value. They’ve only bought back 5% of their stock (in 2023) and no repurchases in 2024 which is concerning.
Total nonperforming assets to total assets has decreased year-over-year since 2019 and as of the end of 2023 it was 0.46%. About 40% of their deposits are CDs which is fine. The ROEs have vacillated between -8.8% to 14.6%.
BV Financial Inc (BVFL) launched their second step conversion in August of 2023. Their ROE in 2023 was 9.2% which is great. The percentage of of non-performing assets was only 1.22%. The deposit mix looks good with only 27% in CDs. The company is only trading at 79% of book value and on July 31, 2024 they received approval to do a 10% share buyback.
Quotes & Charts
“If you want to get good at something which is competitive, you have to think about it a lot, and learn a lot, and practice doing it a lot. And the way the world is constructed in this field, you have to keep learning, because the world keeps changing and your competitors keep learning. So you just have to get up each morning and try and go to bed that night a little wiser than you were when you got up. And if you keep doing that for a long time — and accumulate some experience, good and bad, as you try and master what you’re trying to do — people who do that almost never fail utterly. They may have a bad period when luck goes against them or something. But very few people have ever failed with that. If you have the right temperament, you may rise slowly but you’re sure to rise…. If you have that temperament, you are gradually going to learn. And if you don’t have that temperament, I can’t help you.” —Charlie Munger
In How to Read a Book, Mortimer Adler identifies four levels of reading:
- Elementary Reading
- Inspectional Reading
- Analytical Reading
- Syntopical Reading
“Have maximum financial flexibility to face both hazards and opportunities.”
— Charlie Munger
“Courage is knowing it might hurt, and doing it anyway. Stupidity is the same. And that’s why life is hard.”
— Jeremy Goldberg
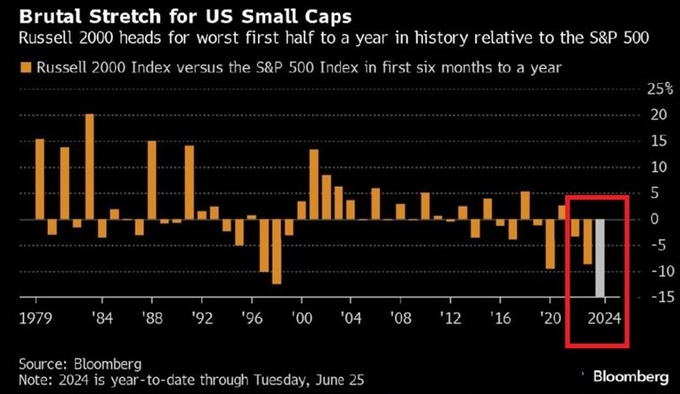
Source: https://x.com/Barchart/status/1807966442106560652?t=K26K8BqObkubwd6J3Ar2TQ&s=19
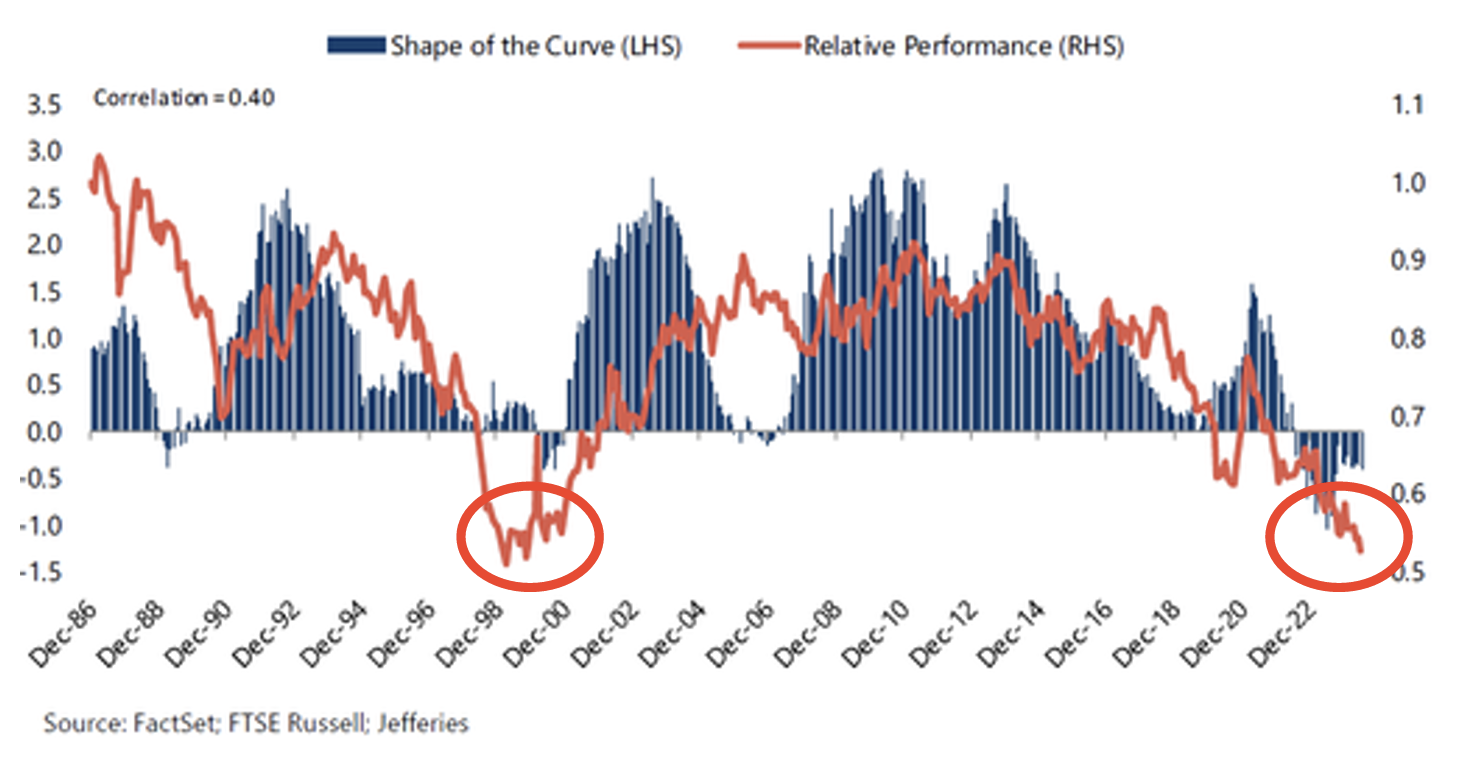
“As the valuation chart below highlights, small caps also remain significantly out of favor. The earnings recession over the past year has been a significant headwind to 2023 and YTD performance. We see a nice opportunity for small cap earnings to reaccelerate over the coming 6 to 18 months. In addition, their relative valuation multiples have been reset to lows last seen in the market bifurcation of the late 1990s. Small caps have also been a historical beneficiary of a steepening of the yield curve. The yield curve has been inverted for nearly 2 years; an eventual steepening could provide a nice tailwind for small cap equities future performance.”
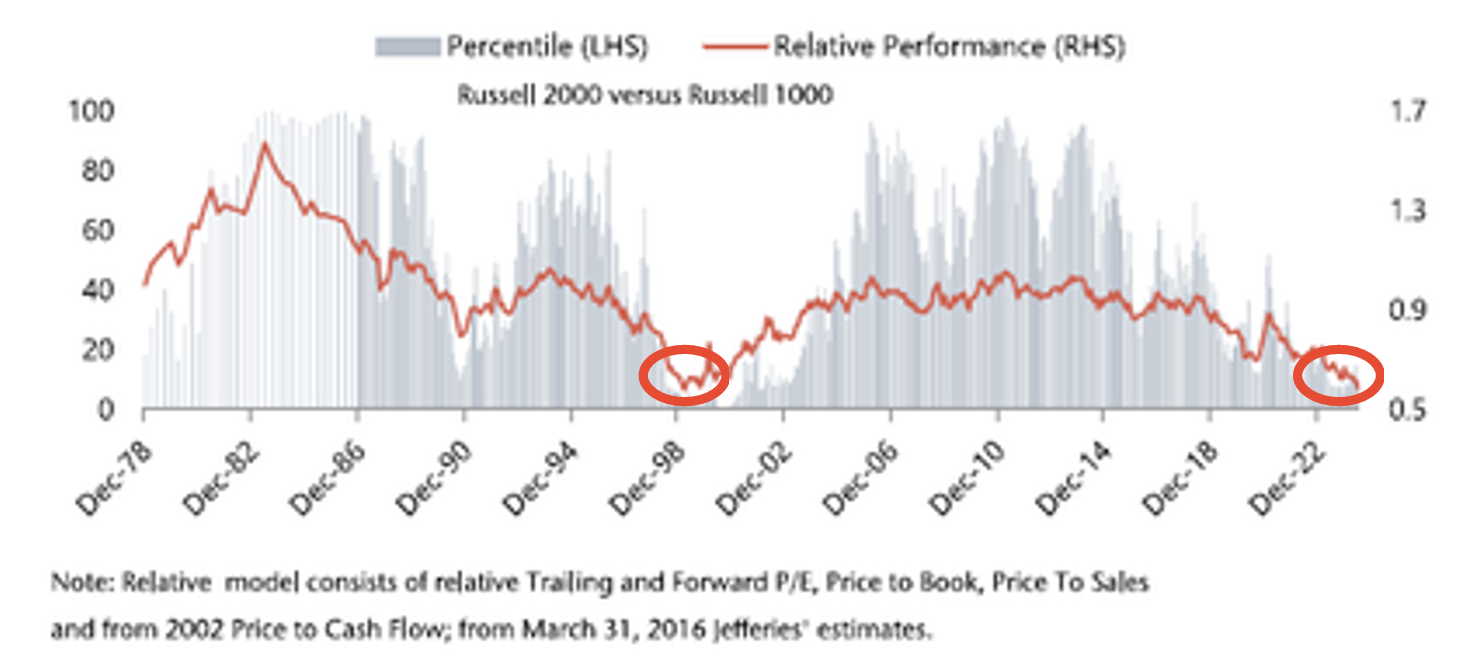
Source: https://millervalue.com/high-active-share-has-greater-value-and-margin-of-safety/

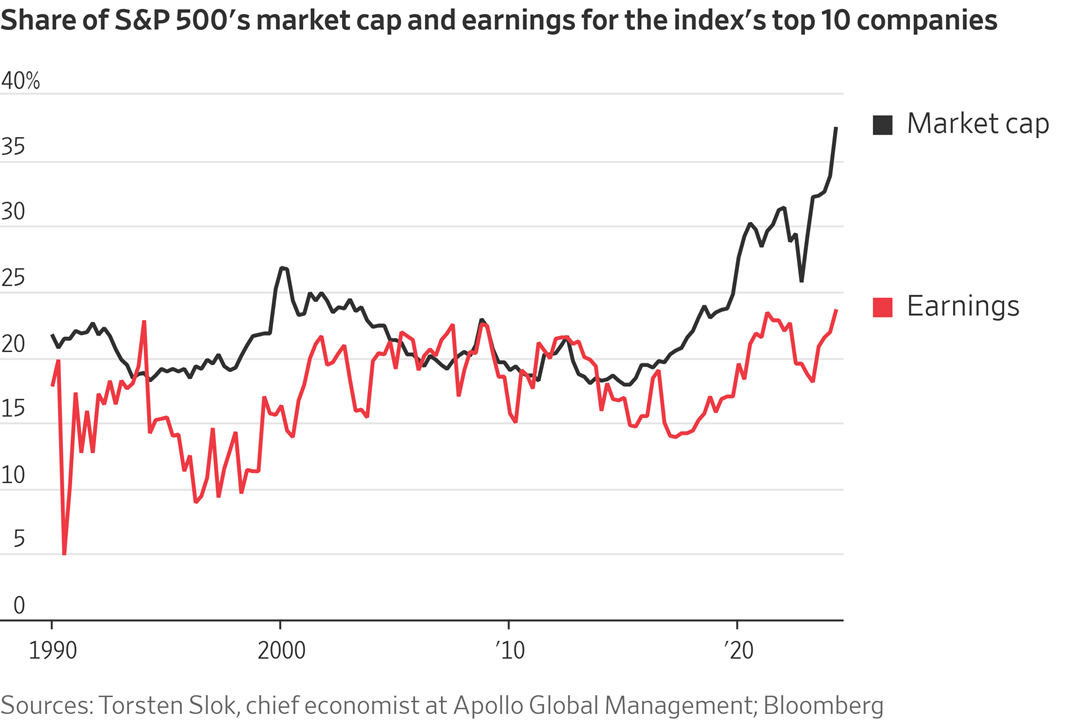
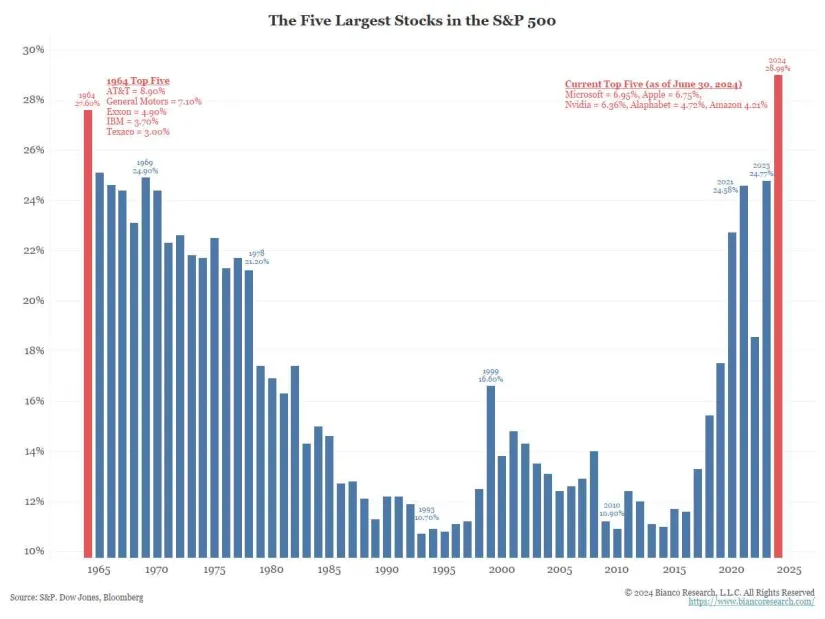
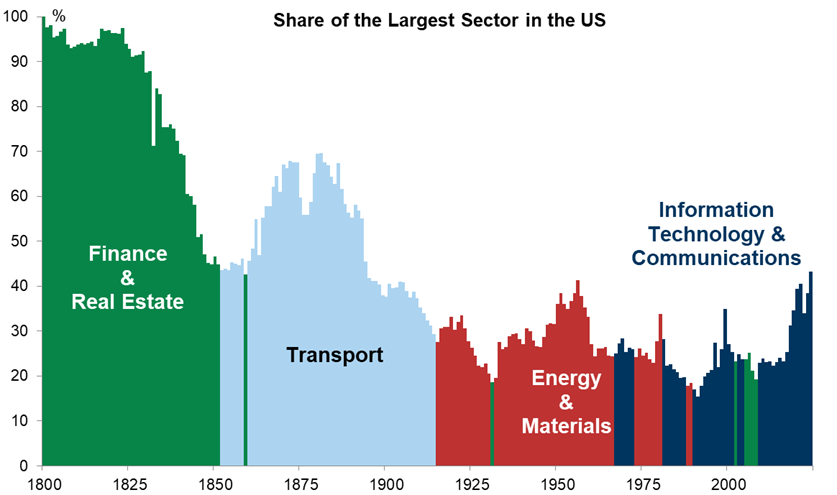
Source: https://www.wsj.com/finance/stocks/sp-500-tech-financial-stocks-weight-62ed530a
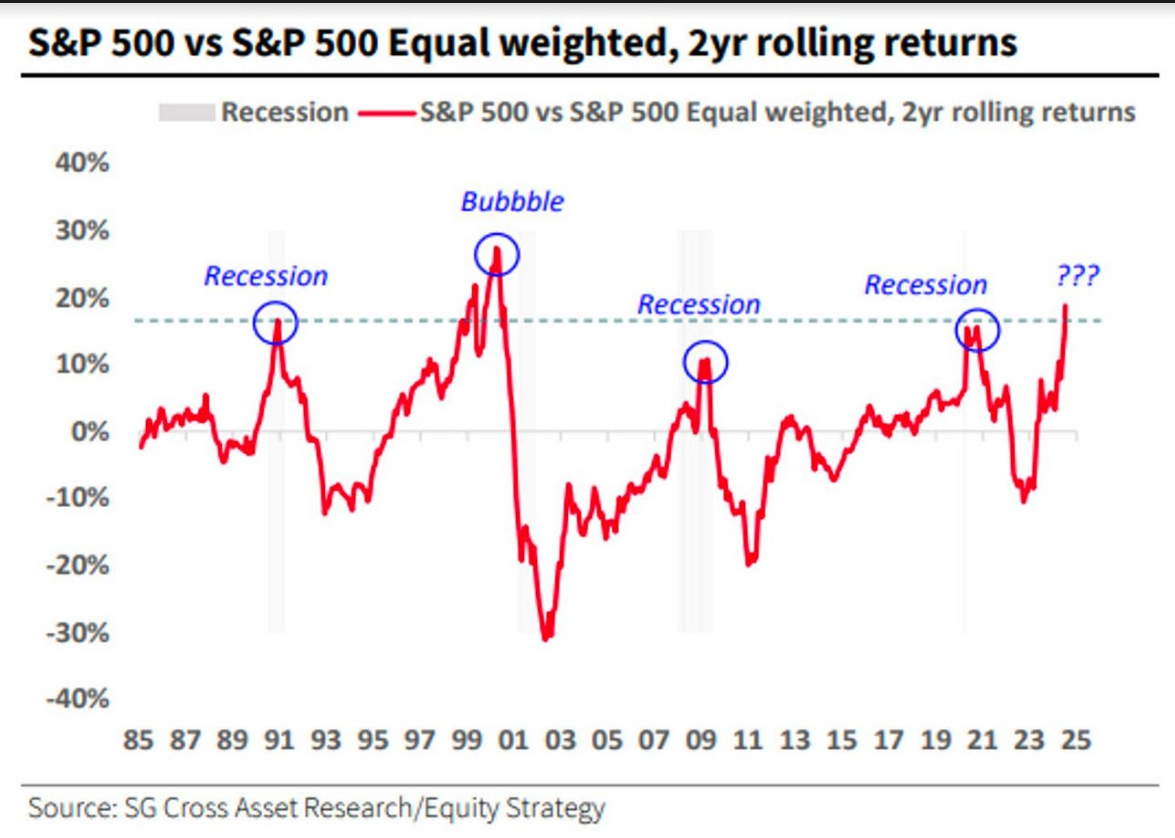
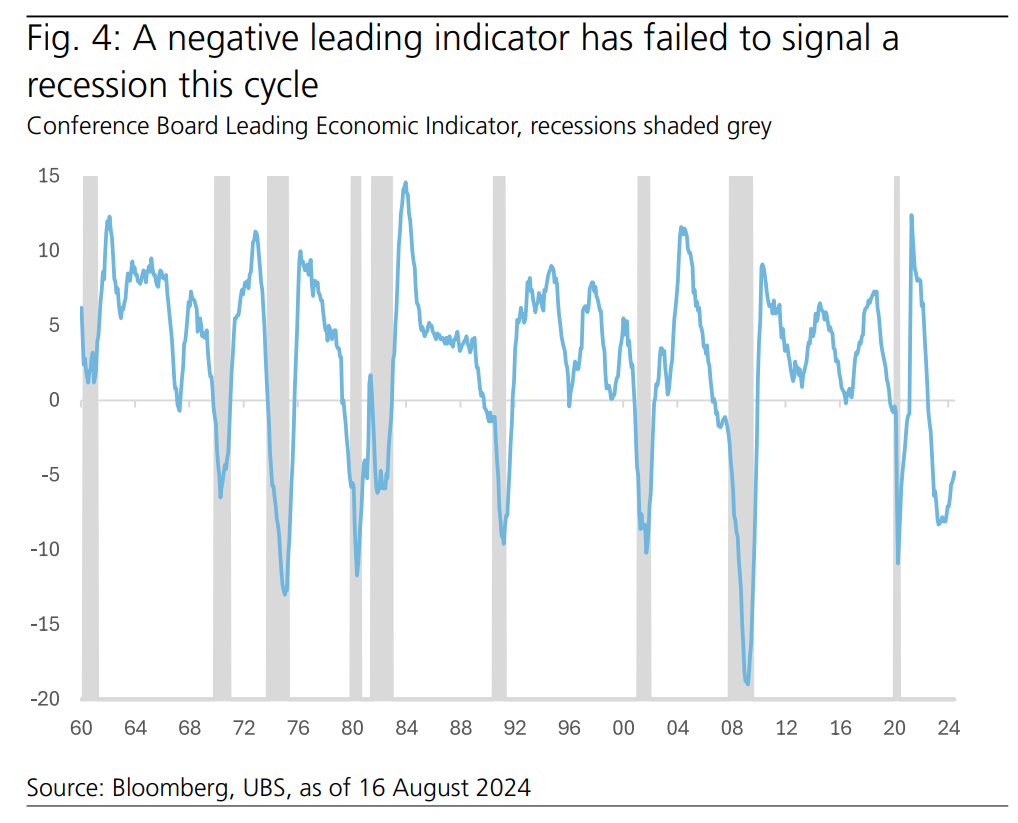
“For proof, look no further than the past month when investors went from seeing a Goldilocks economy in the first half of July to rising recession fears after the July payrolls report, and now back to a soft landing after some positive growth data.”
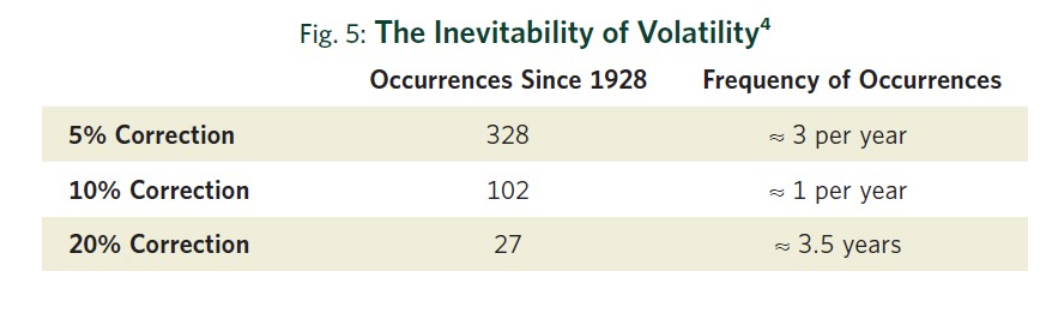
“Plus, previously reliable recession signals—an inverted yield curve, the leading economic indicator (LEI) turning negative, and the Sahm rule—have sent false positives for nearly two years (Fig. 4).”
Source: https://mebfaber.com/wp-content/uploads/2024/08/1724081955236.pdf
Most US stocks, 80% of them, are expensive. They are trading in the most expensive 20% of their valuation history…But some stocks, the deep value 20%, are trading in the cheapest 10% of history.
It’s a similar story outside the US, but even more so. The top 50% are still trading expensive, but the bottom half looks good, and the bottom 20% is in the cheapest 2% of history.
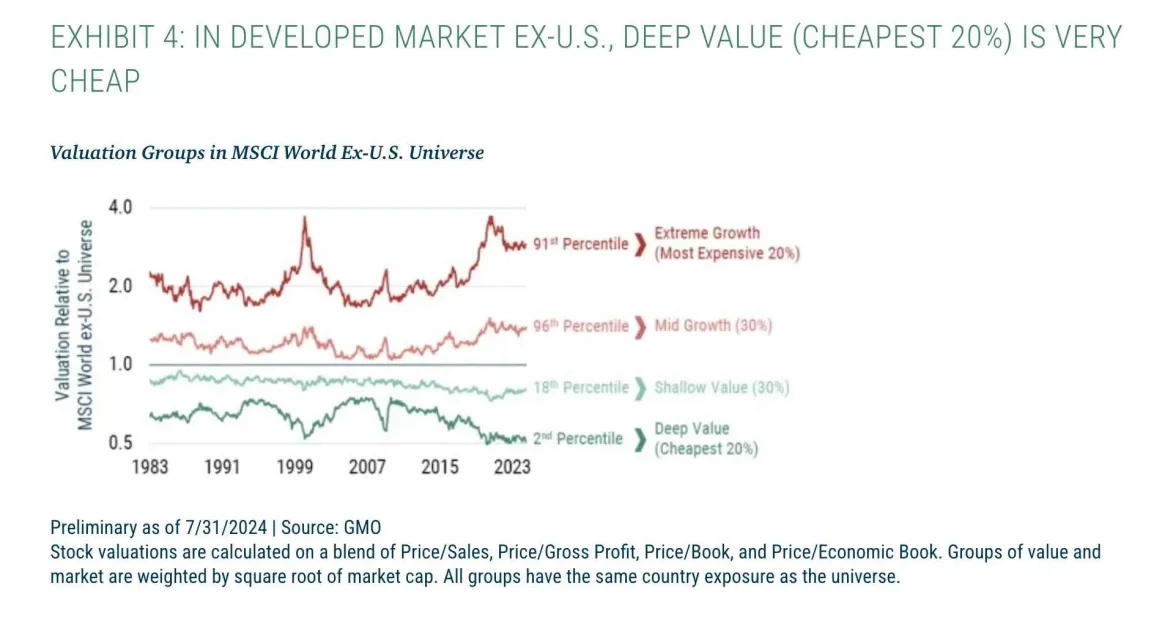
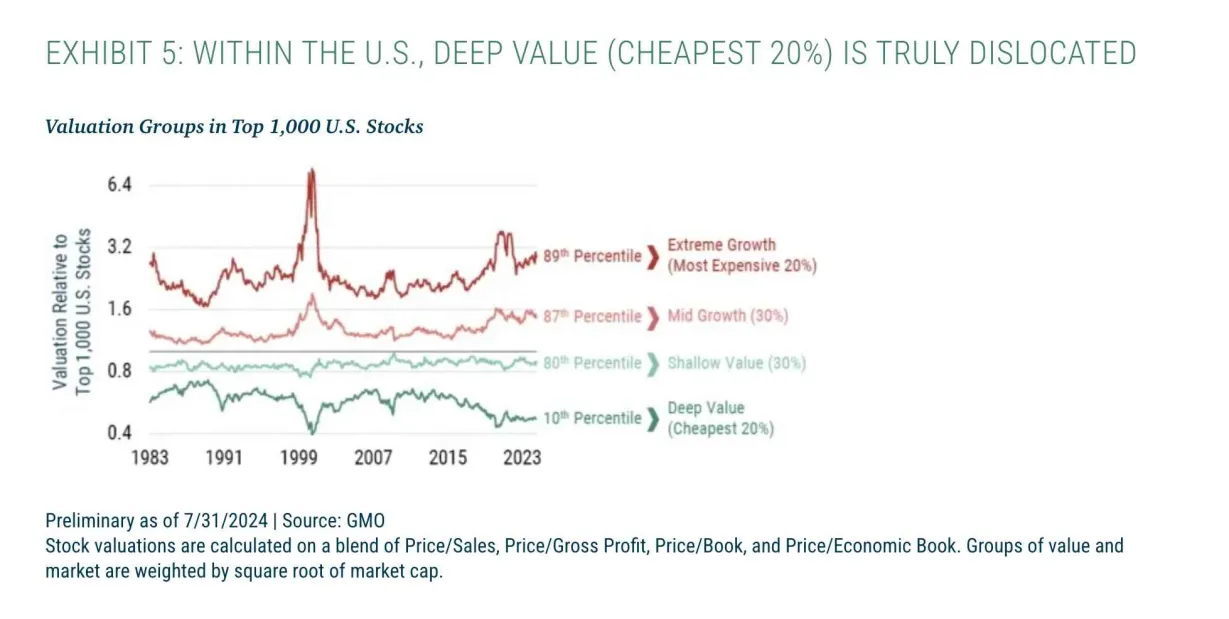
Source: https://www.gmo.com/americas/research-library/deep-value_insights/
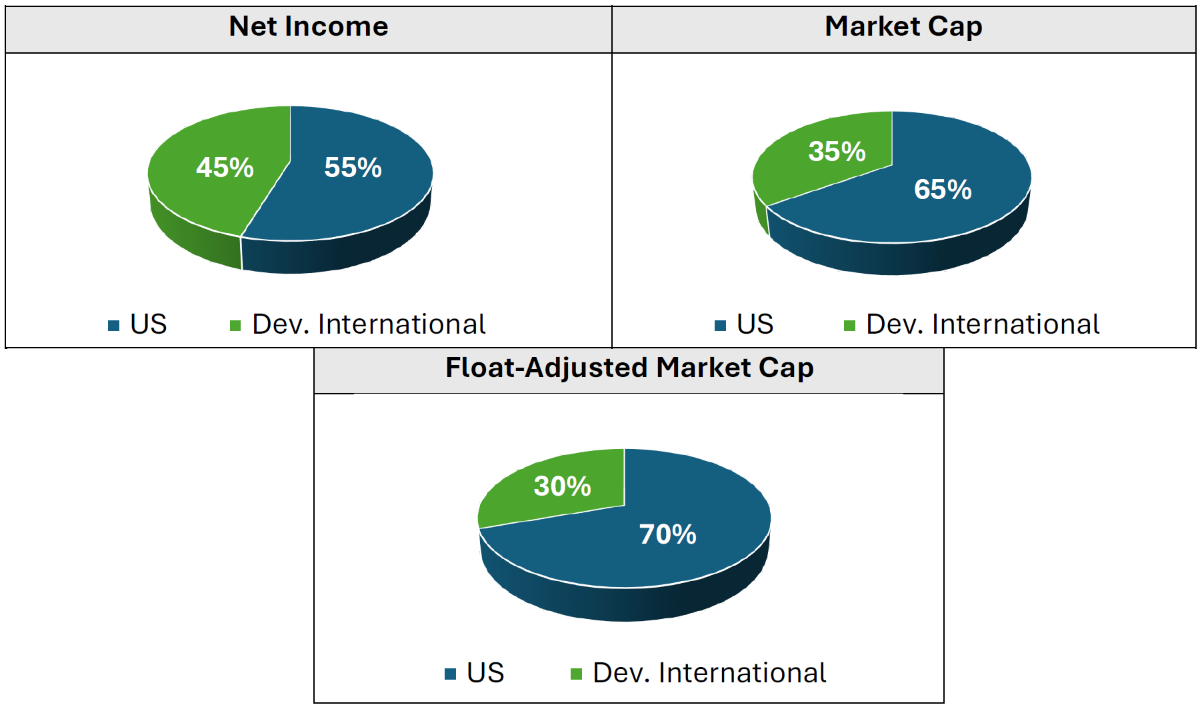
“Beyond the doubtful accuracy of long-term growth forecasts, commercial indices further orient investors toward questionable allocations by focusing on float-adjusted market capitalization. This means more weight is given to stocks that have a higher proportion of shares available to trade freely on the stock exchange, as opposed to the strategic ownership stakes held by founders and other company insiders. The reason commercial indices prioritize free float is because they are designed for deploying capital at massive scale, especially for the likes of Vanguard and BlackRock. And it also happens to be the case that US firms tend to have a higher proportion of free float relative to their international peers in Europe and Japan. Therefore, the free-float adjustment further exacerbates the bias toward high-expectation US stocks, raising the US allocation by 5 percentage points to a 70% weight when developed market stocks are sorted by float-adjusted market cap.”
Source: https://mailchi.mp/verdadcap/the-great-rotation?e=e1c5773556
“The first question: What is diversifying, and what isn’t? The chart below shows the 10-year trailing correlation of equity indices segmented by style, size, and region to the S&P 500.”
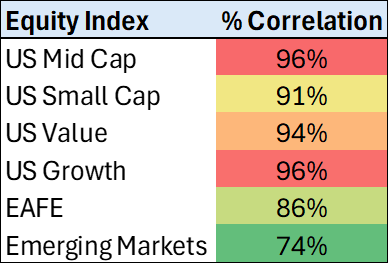
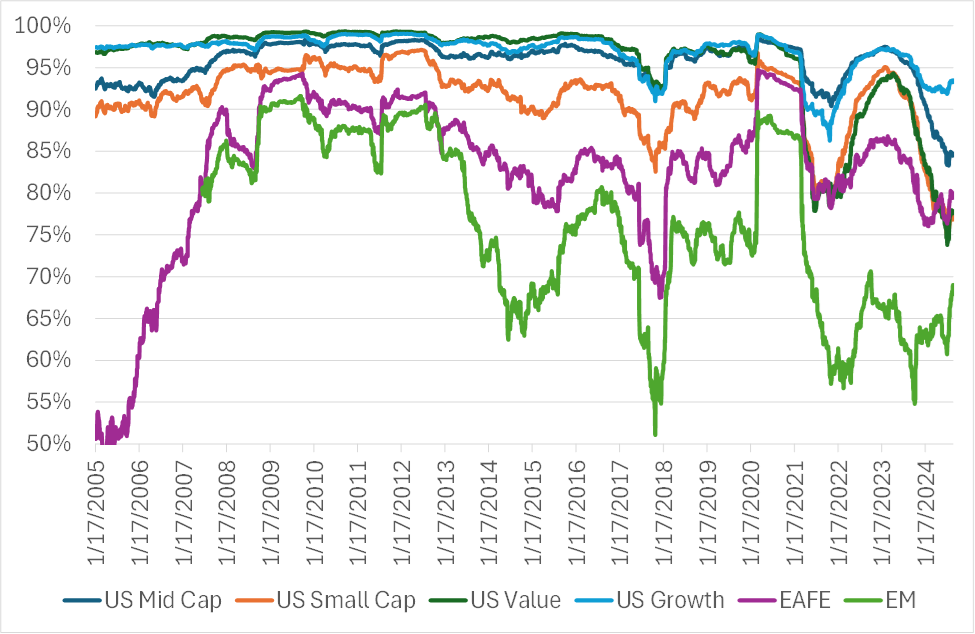
Source: https://mailchi.mp/verdadcap/diversifying-equity-portfolios?e=e1c5773556
Source: https://davisfunds.com/funds/nyventure-fund/pm-review

“Since 1988, EM equities have delivered positive performance 24 months after the last Fed rate hike in four of the past five Fed rate cycles.”


