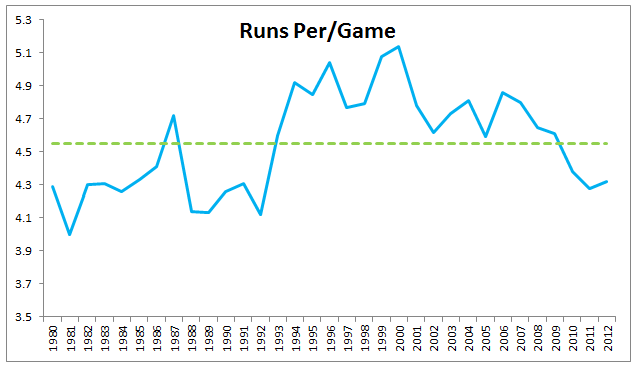
Pitching has become more dominant than ever. The manifestation of this dominance can be shown in the number of runs scored per game. During the last two years the average runs per game has not been this low since 1992. Below is a graph of the average runs per game since 1980. The green line represents the average (4.55 runs).

During our draft prep, we (fantasy owners) can often times have the blinders when on when it comes to the evaluation of and ranking of hitters. More specifically, we only focus on players who hit home runs, generate RBIs, and steal a lot of bases. I was not immune to this way of thinking as well. If you check my initial rankings in my fantasy guide you’ll notice I completely buried players how could score a lot of runs and propped up players who hit a lot of home runs. Quick guess, how many players scored 85+ runs last year? 48, that’s it. Last year it was 37! Let’s not jump the gun here. Maybe scoring runs isn’t as scarce as home runs. The table below shows the number of players who scored 85+ runs and 25+ home runs.
|
Year |
85+ Runs |
25+ Home Runs |
|
1980 |
33 |
17 |
|
1982 |
49 |
29 |
|
1983 |
29 |
22 |
|
1984 |
39 |
25 |
|
1985 |
36 |
31 |
|
1986 |
44 |
31 |
|
1987 |
60 |
53 |
|
1988 |
32 |
22 |
|
1989 |
24 |
18 |
|
1990 |
34 |
22 |
|
1991 |
40 |
31 |
|
1992 |
35 |
20 |
|
1993 |
52 |
31 |
|
1995 |
42 |
37 |
|
1996 |
80 |
61 |
|
1997 |
71 |
49 |
|
1998 |
84 |
52 |
|
1999 |
94 |
64 |
|
2000 |
90 |
67 |
|
2001 |
65 |
65 |
|
2002 |
67 |
54 |
|
2003 |
68 |
57 |
|
2004 |
75 |
58 |
|
2005 |
60 |
45 |
|
2006 |
78 |
54 |
|
2007 |
74 |
46 |
|
2008 |
69 |
50 |
|
2009 |
58 |
55 |
|
2010 |
49 |
44 |
|
2011 |
37 |
42 |
|
2012 |
48 |
44 |
I starting playing fantasy baseball in the late 90s when scoring a lot of runs was common. However, with runs becoming more of a premium, players who score a lot of runs are just as scarce as home run boppers. Currently players who are projected to score a lot of runs and steal a lot of bases: Ben Revere, Denard Span, and Jon Jay have only have ADPs (at Mock Draft Central) of 190, 237 and 265 respectively. However, power only players are going higher in drafts. For example, Kendrys Morales, Ryan Ludwick and Dayan Viciedo have ADPs of 148, 158 and 183 respectively.
I recommend “reaching” for players (Revere, Span, or Jay) who are expected to bat lead off for a team the entire year than players whose primary upside is only power (Ludwick and Viciedo) because power will be easier to find later in drafts. For example, last year 79 players hit 20+ home runs compared to only 61 players scoring 80+ runs.
The key for scoring a lot of runs is a function of opportunity and skill. The higher a player hits in the lineup, the greater the likelihood he’ll score runs. Last year lead off hitters scored the most runs than any other position. Batting second and third were second and third respectively.Below are players you could draft late in the later rounds who could score 85+ runs.
|
Player |
|
Whoever bats second in the Angels Lineup |
|
Josh Rutledge, COL |
|
Daniel Murphy, NYM |
|
Dustin Ackley, SEA |
|
Yunel Escobar, TB |
|
Denard Span, WSH |
|
Michael Young, PHI |
|
Ben Revere, PHI |
|
Angel Pagan, SF |
|
Dexter Fowler, COL |
|
Alejandro De Aza, CHW |
|
Norichika Aoki, MIL |
|
Jon Jay, STL |


